- Dogecoin hits an eight-week high after clearing key resistances, surging nearly 50% in July so far.
- DOGE faces seven-month resistance; overbought RSI may challenge bulls aiming to erase 22% yearly loss.
- DOGE/USD’s pullback may stall near 200-day SMA and key old resistance lines.
Dogecoin (DOGE/USD) surges 13% intraday to $0.2490 during Friday’s European session, around $0.2400 by the press time, as it reaches the highest level since late May and record nearly 50% gains for July.
The DOGE rally justifies an upside break of the 200-day Simple Moving Average (SMA) and key multi-month resistance lines, now supports, alongside bullish signals from the Moving Average Convergence Divergence (MACD) indicator.
However, the 14-day Relative Strength Index (RSI) indicates overbought conditions, and a seven-month horizontal resistance may challenge the DOGE/USD bulls aiming to reverse a 22% loss over the past year.
DOGE/USD: Daily Chart peaks buyer’s interest

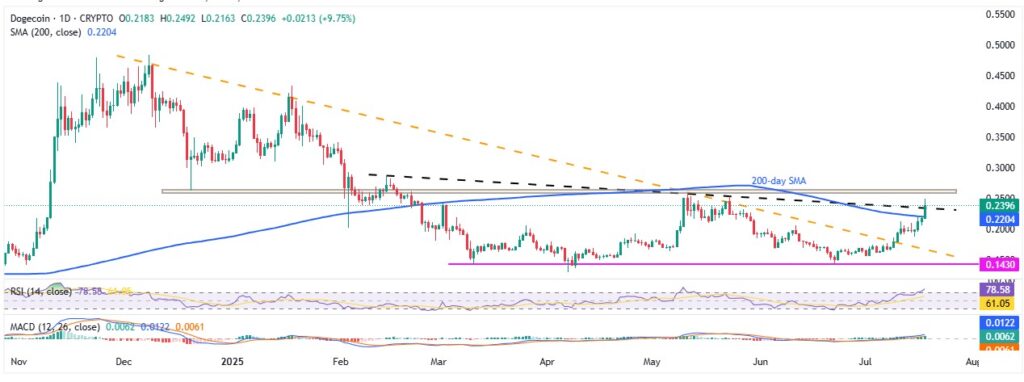
A successful break above the descending resistance lines from December 2024 and February 2025, along with the 200-day SMA, supported by bullish MACD signals, keeps DOGE/USD buyers optimistic about challenging a strong horizontal resistance zone between $0.2600 and $0.2630, marked since December 2024.
However, with the RSI at an overbought level near 79.00, a period of price consolidation near this key resistance is likely before any further rally. Another immediate hurdle is the mid-February swing high at $0.2865.
If buyers can push DOGE/USD above $0.2865, the next target will be the $0.3000 level, followed by multiple resistance levels near $0.3100, established in late 2024 and early 2025. Clearing these could propel prices toward $0.3500 and $0.4000, eventually aiming for the yearly high of $0.4341 set in January.
Alternatively, short-term support is provided by the downward resistance line from February near $0.2350 and the 200-day SMA at around $0.2200.
Following that, key defense levels for buyers include a seven-month-old resistance line and the lows from early March near $0.1680 and $0.1430, respectively.
DOGE/USD: Four-Hour chart signals a rough ride up

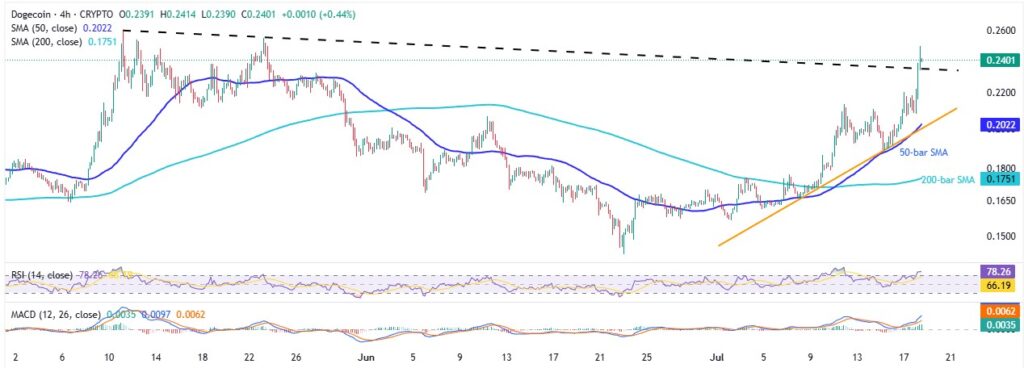
On the four-hour chart, Dogecoin recently crossed a two-month resistance line, which now acts as immediate support around $0.2350. This move extends the rebound that began earlier in the week from the 50-bar SMA and a support trendline established two weeks ago.
However, similar to the daily chart, the RSI is in overbought territory, suggesting that resistance around $0.2600—last seen in May—may be difficult to overcome. Even if DOGE manages to breach the $0.2600 mark, additional resistance levels highlighted on the daily chart could cap further gains.
On the downside, a break below the $0.2350 support could expose the early-July swing high near $0.2140. Below that, the 50-bar SMA at $0.2000 and the fortnight-old support trendline at $0.1990 may attract sellers.
If DOGE weakens further beyond $0.1990, the 200-bar SMA near $0.1750 will be the next key support to watch, along with other levels from the daily chart.
Overall, Dogecoin shows potential to remain bullish after recent breakouts. However, a complete reversal of its yearly losses still appears challenging in the near term.


