- Dogecoin price bounces off 21-day EMA, paring the biggest daily loss in three weeks.
- RSI backs DOGE’s gradual recovery from early August.
- Six-month trading range and sluggish MACD signals could challenge buyers.
- Dogecoin shows short-term bullish consolidation, but its multi-month trading range is likely to persist.
Dogecoin (DOGE) price trades in green on Friday. The price opened higher and gained 3% to touch the high of $0.2324 during the day. However, as the day progressed, the coin lost its traction but managed to stay in the positive territory.
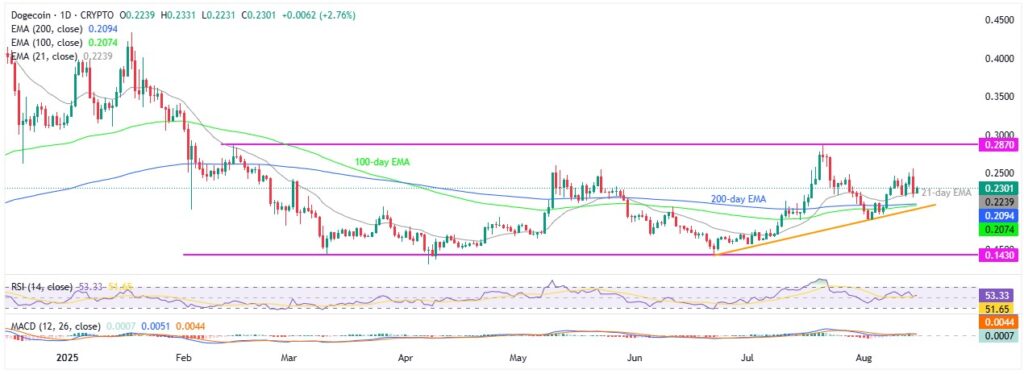
The memecoin’s latest rebound portrays the market’s consolidation of Thursday’s heavy losses, the biggest in three weeks, as well as a clear U-turn from the 21-day Exponential Moving Average (EMA).
The DOGE’s U-turn from the short-term EMA also gains support from the trading volume and portrays an uptick in the market capitalization. That said, the daily trading volume for Dogecoin is $4.54 billion, per Santiment, whereas the market cap ticks up to $34.69 billion at the press time.
Dogecoin Price: Daily Chart Signals Recovery Within Range

Dogecoin’s rebound from the 21-day EMA, supported by the 14-day Relative Strength Index (RSI) holding above 50.0, suggests a continuation of the latest upside toward the weekly high near $0.2560.
The May high of $0.2595 will be the last easy hurdle for DOGE bulls before facing the six-month range top near $0.2870. However, the Moving Average Convergence Divergence (MACD) indicator remains sluggish, signaling weak upside momentum and reinforcing each resistance level.
If Dogecoin remains firmer past $0.2870, a quick jump to the $0.3000 threshold can’t be ruled out. Following that, a steady run-up eyeing the yearly high of $0.4345 could be welcomed.
Meanwhile, DOGE pullback has multiple downside support levels starting with the 21-day EMA of $0.2305, followed by a convergence of the 100-day and 200-day EMA, near $0.2095-$0.2075.
Below that, a three-week support around $0.2040 and the monthly low of $0.1895 could test the Dogecoin bears before directing them to the six-month trading range’s bottom of $0.1430.
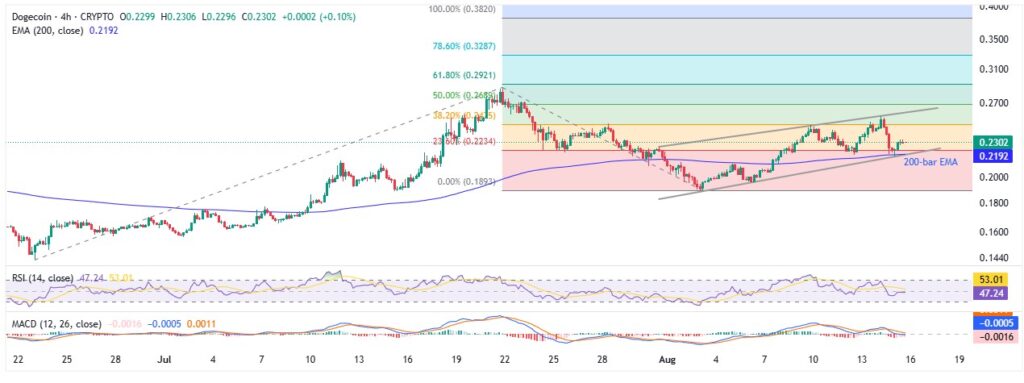
Dogecoin Price: Four-Hour Chart Highlight Bullish Channel

The DOGE’s latest rebound from the 200-bar EMA and a fortnight-old ascending trend channel keeps the buyers hopeful on the four-hour chart. However, the RSI is below the 50.00 neutral level, and the MACD signals are downbeat as well, which in turn suggests slower grind towards the north.
Hence, the short-term bullish channel, currently between $0.2600 and $0.2190, is likely to prevail. Adding strength to the downside support is the 200-bar EMA, pointing to a deeper fall should the quote break the $0.2190 support confluence, highlighting the monthly low of $0.1894 and the daily chart support levels.
Alternatively, the DOGE’s run-up beyond the $0.2600 could aim for July’s peak of $0.2695 and the 61.8% Fibonacci Extension (FE) of its June-August moves, near $0.2925.
Should the memecoin remain firmer past $0.2925, the 78.6% and 100% FE levels, near $0.3290 and $0.3820 in that order, will precede the daily chart resistance levels to lure the bulls.
Conclusion
Dogecoin’s rebound from the 21-day EMA gains support from the RSI to indicate a continuation of the short-term run-up. Still, the broad six-month trading range is likely to cap long-term gains of the memecoin.
Also read: Cathie Wood’s Ark Invest Snaps Up $177M in Bullish Shares After Explosive IPO


