- Dogecoin reverses from 21-day EMA as bears return after 50% slide in 1H 2025.
- Crucial four-month base separates DOGE from revisiting late 2024 lows.
- DOGE/USD recovery stalls under $0.2060–May’s peak is the bullish linchpin.
- Repeated rejections at key resistance and mixed momentum keep sellers in play.
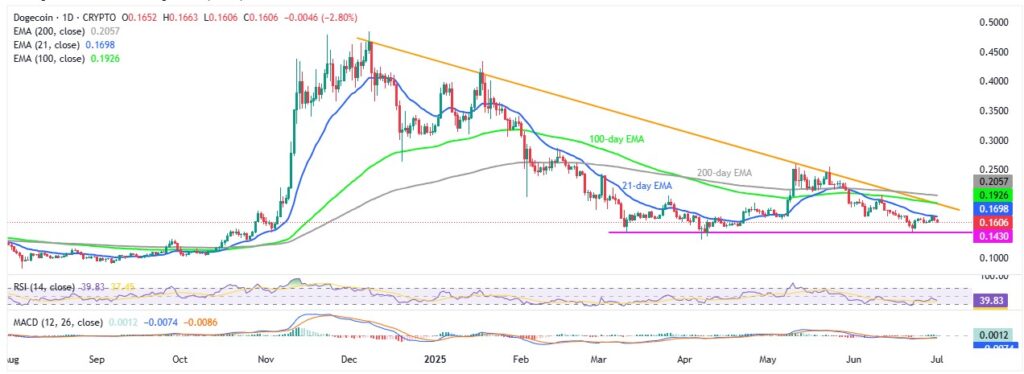
Dogecoin (DOGE/USD) refreshes its intraday low near $0.1580 on Tuesday’s U.S. session, extending Monday’s pullback from the 21-day Exponential Moving Average (EMA). This marks the DOGE/USD pair’s third failed attempt to break above the short-term EMA since late May, reinforcing the possibility of further downside—especially after brief rebound from a nearly 50% slump during the first half of 2025 (1H 2025).
Adding to the bearish pressure are mixed signals from the Moving Average Convergence Divergence (MACD) indicator and a sluggish 14-day Relative Strength Index (RSI). Also weighing on sentiment is May’s rejection from an eight-month-old descending resistance line and continued trading below key EMAs. However, a crucial horizontal support zone—active since March—continues to defend against further losses and remains a key focus for traders in the near term.
DOGE/USD: Daily chart appears bearish

Source: TradingView
Dogecoin (DOGE/USD) shows multiple signs of weakness as it turns down from the 21-day EMA near $0.1700, with a neutral 14-day RSI near 50.00 and mixed signals from the MACD. These indicators suggest a likely retest of the key horizontal support around $0.1430, which has held off bears since March. Before that, April’s low near $0.1550 acts as immediate support.
While DOGE may find support and rebound from the $0.1430 zone—considering RSI behavior and historical price action—a daily close below this level could open the door for a slide toward the yearly low at $0.1300, and potentially the October 2024 bottom near the $0.1000 mark.
On the flip side, a clear break above the 21-day EMA at $0.1700 wouldn’t guarantee bullish momentum. DOGE/USD bulls would still face a key hurdle near $0.1930, where the 100-day EMA converges with an eight-month-old descending resistance line. If bulls manage to clear that, the next significant resistances are the 200-day EMA around $0.2060 and May’s peak near $0.2600—both acting as major bearish defenses.
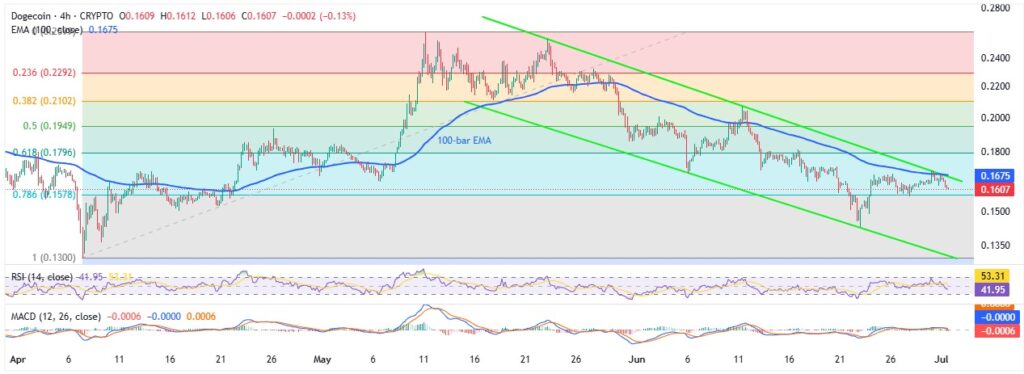
DOGE/USD: Four-Hour chart portrays a descending channel

Source: TradingView
A five-week-old descending channel continues to guide Dogecoin (DOGE/USD) lower, keeping sellers hopeful as long as the price stays within the $0.1675–$0.1310 range. Reinforcing the channel’s upper boundary is the 100-bar Exponential Moving Average (EMA), which, alongside bearish signals from the Moving Average Convergence Divergence (MACD) indicator and a downbeat Relative Strength Index (RSI), supports the bearish bias.
Alternatively, the June and April lows—near $0.1430 and $0.1300, respectively—serve as important levels to monitor, in addition to the support zones highlighted on the daily chart.
If DOGE/USD manages to break above the $0.1675 resistance, the next upside targets include the psychological $0.2000 mark, followed by June’s peak at $0.2064 and the broader resistance cluster outlined in the daily timeframe.
In summary, Dogecoin is likely to revisit the key $0.1430 support area, though a fresh yearly low appears unlikely for now.


