- Dogecoin drops for seventh consecutive day, testing six-week-old rising support line.
- Weak RSI shows slow momentum but bearish MACD signals, sustained trading below 50-day SMA support DOGE sellers.
- Clear break of $0.1700 points DOGE/USD to $0.1430 support, bulls remain sceptical below 200-day SMA.
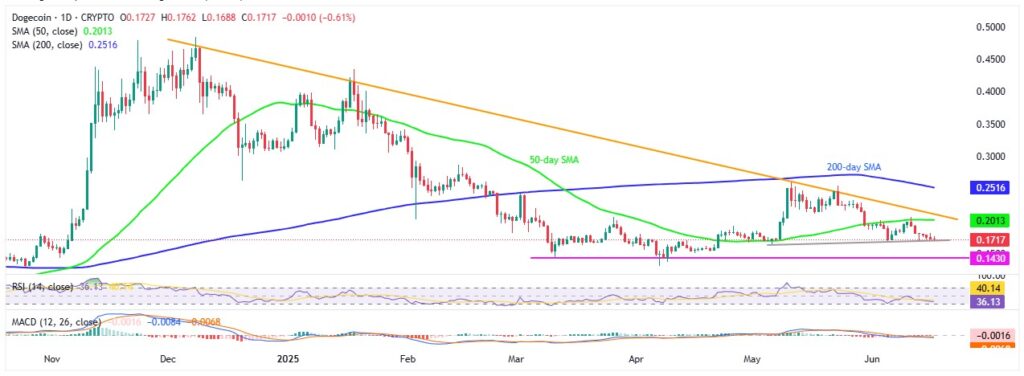
Dogecoin (DOGE/USD) prints a seven-day losing streak as it pokes an upward-sloping trend line support from early May, close the $0.1700 by the press time of Tuesday’s European session. In doing so, the DOGE extends the previous week’s U-turn from the 50-day Simple Moving Average (SMA) even as the sluggish momentum indicators challenge quick fall in prices.
DOGE/USD: Daily Chart Points To Gradual Downside Moves

Source: Tradingview
Given the 14-day Relative Strength Index (RSI) below the neutral 50.0 level and the Moving Average Convergence and Divergence (MACD) indicator showing weak signals, Dogecoin sellers have lost some momentum recently. However, the DOGE/USD pair’s steady decline after reversing from the 50-day SMA keeps sellers hopeful of breaking the immediate support near $0.1700, which has held since early May.
A break below this level could open the door for a southward move toward a three-month-old horizontal support around $0.1430, before possibly targeting the yearly low near $0.1300. The sluggish momentum from RSI and MACD suggests Dogecoin’s gradual decline, highlighting the $0.1500 and $0.1600 levels as intermediate support zones.
On the upside, a recovery could face resistance at the 50-day SMA near the key psychological level of $0.2000. A break above this could push prices toward a downward-sloping resistance line from early December 2024, close to $0.2125.
It’s important to note that the 200-day SMA, currently near $0.2520, stands as the last major defense for sellers before bulls potentially take control.
DOGE/USD: Four-hour chart also favors Bears

Source: Tradingview
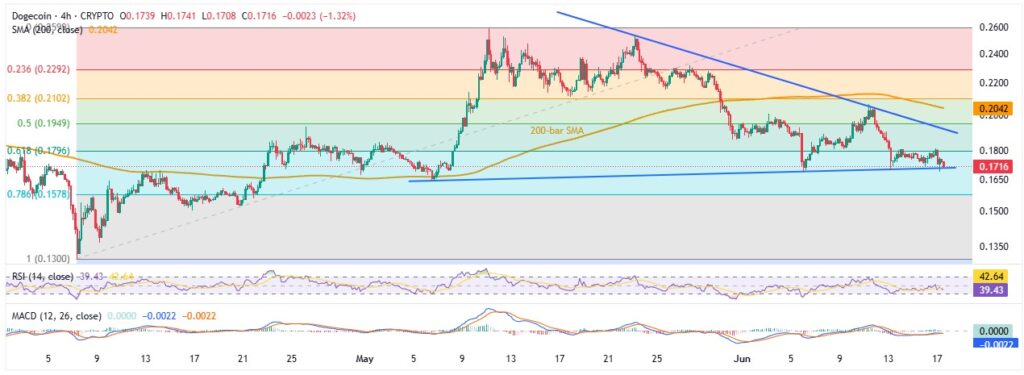
The four-hour chart shows a symmetrical triangle pattern forming between $0.1700 and $0.1930, representing Dogecoin’s six-week price action. At present, DOGE/USD is testing the lower boundary of this pattern near $0.1700.
Similar to the daily chart, the four-hour timeframe also displays slow bearish signals from both the RSI and the MACD indicators, reinforcing the significance of the $0.1700 support mark.
Another key support level to watch is the 78.6% Fibonacci Retracement of the April–May rally, located around $0.1580, in addition to the support levels highlighted on the daily chart.
On the flip side, a breakout above $0.1930 would need confirmation from both the psychological barrier at $0.2000 and the 200-bar SMA near $0.2042 to give bulls enough momentum to revisit higher resistance levels outlined on the daily timeframe.
In summary, Dogecoin remains under pressure and may break the immediate key support at $0.1700. However, any further decline is likely to be gradual as the price drifts toward the yearly low.


