- Dogecoin price breaks out of a two-month bullish triangle, hitting a two-week high on Monday.
- Overheated Stochastic may offer intermediate pauses during the anticipated rise to test the multi-month range resistance.
- Sustained trading beyond key SMAs strengthens Dogecoin’s bullish outlook.
- DOGE may see a short-term rise, but crossing a multi-month range needs a strong bullish fundamental catalyst.
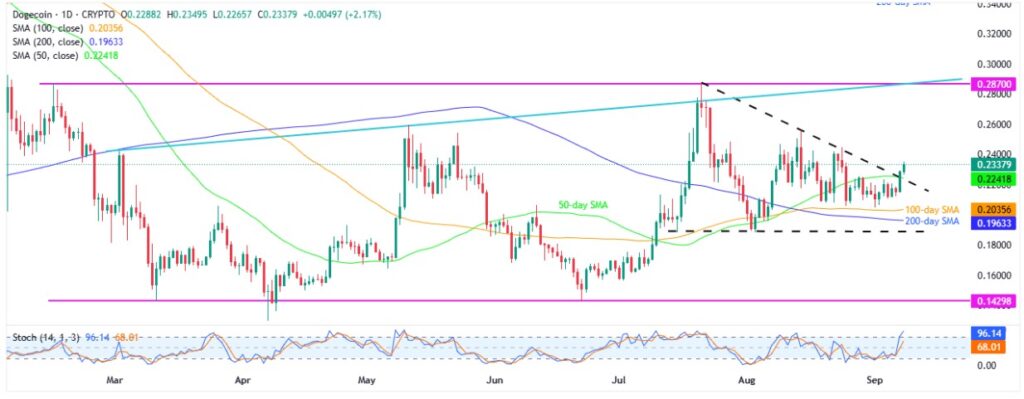
Dogecoin (DOGE) price jumps over 2.0% intraday to $0.2340 during Monday’s European session, justifying a bullish technical breakout to hit a fortnight’s high.
Apart from a two-month triangle breakout, the DOGE’s successful upside clearance of the 50-day Simple Moving Average (SMA), and a sustained trading past the 100-day and 200-day SMAs, also strengthen upside bias surrounding the key memecoin.
Also backing the quote’s rise is a two-week high in trading volume and market capitalization. That said, DOGE’s daily trading volume jumps to $3.03 billion, and the market cap also rises to $35.28 billion, both hitting fortnight highs, according to Santiment data.
Meanwhile, news from CCN cites fresh filling by Rex-Osprey DOGE exchange-traded fund (ETF) to secure regulatory approval, side-stepping the long 19b-4 and S-1 processes, seemed to have fuelled the price. The latest ETF submission will help the memecoin ETF to go live before more than 90 other crypto ETF filings.
Also read: Why 75% of Traders Bet on DOGE Upside? Read Out Here!
With this, Dogecoin’s seven-month trading appears at risk, even as the overheated Stochastic might offer intermediate halts during the anticipated rally.
Dogecoin Price: Daily Chart Lures Buyers

DOGE’s successful break of the $0.2240 resistance confluence, now support, comprising the 50-day SMA and a two-month descending triangle, helps the buyers cheer a fortnight high.
Still, overheated conditions of the Stochastic momentum indicator suggest a consolidation in the memecoin’s price before targeting the previous monthly high of around $0.2540.
Beyond that, the DOGE will face the key $0.2870 resistance confluence where its seven-month range top meets an ascending March trend line, a break of which could allow buyers to chase the $0.3000 psychological magnet and the yearly high of $0.4340.
Alternatively, Dogecoin pullback remains elusive beyond the $0.2240 resistance-turned-support.
If the sellers manage to smash the $0.2240 mark, the DOGE’s fresh fall towards the 100-day and 200-day SMAs, respectively near $0.2035 and $0.1960, could gain the market’s attention before the stated triangle’s bottom of around $0.1890.
In a case where the memecoin remains bearish past $0.1890, it becomes vulnerable to slump toward the multi-month trading range’s support line surrounding $0.1430.
Dogecoin Price: Four-Hour Chart Highlights Immediate Resistances

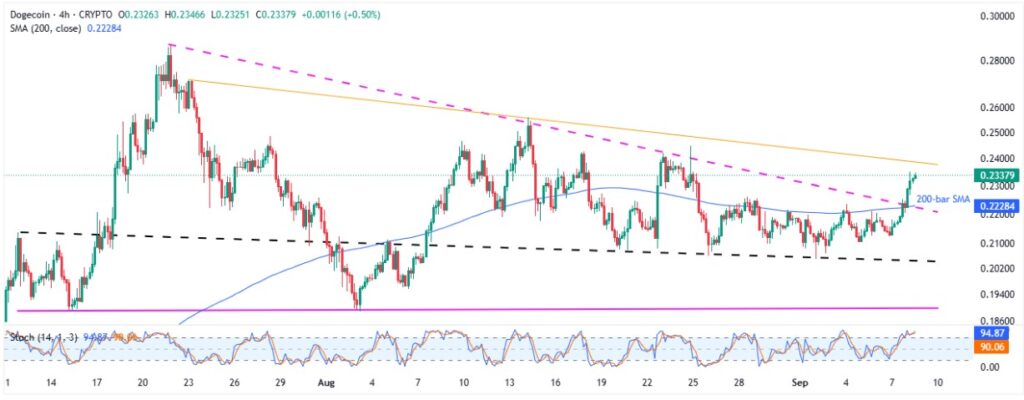
With the Stochastic momentum indicator’s overheated conditions, the DOGE’s four-hour chart highlights a six-week-old descending resistance line surrounding $0.2390 as an immediate upside hurdle.
Beyond that, $0.2450 and $0.2500 may pause the bulls before directing them to the higher levels discussed on the daily chart.
Meanwhile, the triangle’s top joins the 200-bar SMA to restrict short-term Dogecoin downside near $0.2240-30, before a slightly descending trend line from July 11 around $0.2040.
Given the quote’s weakness past $0.2040, which is less likely, the triangle’s bottom of around $0.1890 will be the last defense of the buyers before targeting the yearly low of near $0.1430.
Conclusion
Dogecoin’s recent rally validates the bullish triangle breakout and growing ETF speculation, signaling potential for further gains.
However, overbought stochastic indicators suggest there could be short-term pauses before DOGE challenges the upper limit of its multi-month trading range near $0.2870.
In order to cross the said key resistance, the DOGE will likely require a strong catalyst, possibly the launch of an ETF or an even more significant event.
Also read: Cryptocurrency Weekly Price Prediction: BTC, XRP Rebound, But ETH Lags, amid Fed Rate Cut Buzz


