- Dogecoin price retreats from an 11-day-high, ending a two-day winning streak, as bulls pause on the way to key upside hurdle.
- Clear breakout of three-week resistance, 21-day SMA, and upbeat stochastic keep DOGE buyers optimistic.
- Seven-month ascending trendline lures Dogecoin bulls during four-month uptrend.
- DOGE aims to maintain short-term bullish momentum, but reversing its yearly loss requires strong fundamental support.
Dogecoin (DOGE) price drops 2.0% intraday to $0.2570 early Friday morning in New York, down for the first day in three while reversing from the highest level in 11 days.
Still, Dogecoin holds above a three-week resistance line and keeps the 21-day Simple Moving Average (SMA) breakout, amid bullish Stochastic signals, to keep buyers optimistic.
The DOGE’s two-month price action above key support lines and SMAs, along with buzz around the Dogecoin Exchange-Traded Fund (ETF) and corporate crypto reserves, strengthens the upside bias.
Also read: SEC Asks XRP, SOL, LTC, DOGE Issues to Withdraw 19b-4 Filings, What’s the Reason?
A pullback in the trading volume and market capitalization (market cap) raises doubts about bearish bias surrounding the popular memecoin. According to Santiment, DOGE’s daily trading volume retreats from a week’s high to $3.22 billion, whereas the market cap faces a pullback from the highest level since September 21, to $38.18 billion by press time.
With this, the Dogecoin buyers remain hopeful of approaching the March resistance line, but a reversal of its 18% yearly loss will require a strong fundamental catalyst.
Dogecoin Price: Daily Chart Keeps Buyers Optimistic

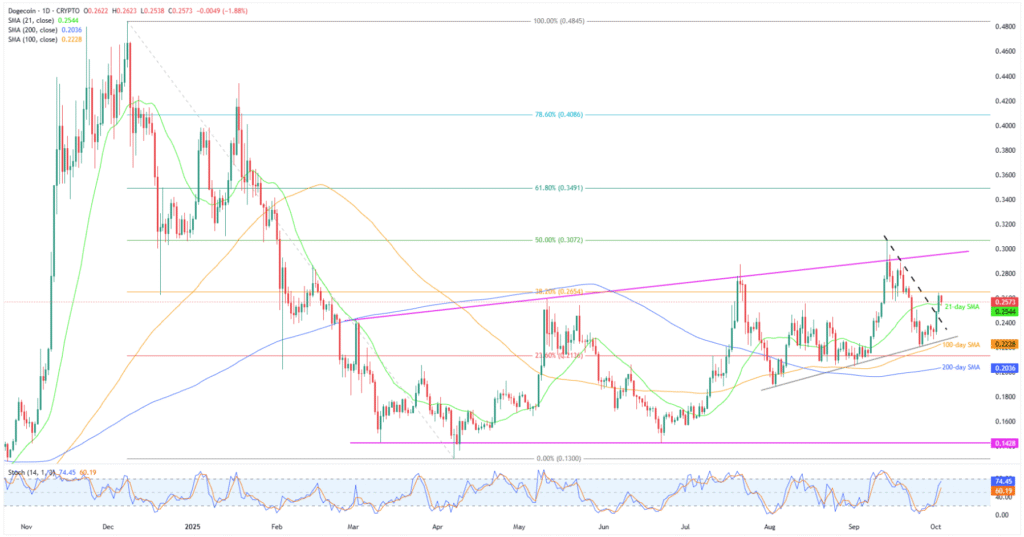
Dogecoin’s performance since early August shows a strong rebound from the 200-day and 100-day SMAs, sustained trading above a two-month support line, and a clear break of the 21-day SMA, reinforcing a bullish bias. Additionally, the Stochastic indicator is well above the neutral 50.00 line, signalling continued bullish momentum and supporting buyers despite the recent pullback.
With this, DOGE is likely to see a price rebound, initially targeting the 38.2% Fibonacci retracement from the December 2024 to April 2025 decline, around $0.2655.
However, the quote’s upside past $0.2655 appears difficult, as an ascending trend line from March, close to $0.2960, becomes a tough nut to crack for the buyers. Also acting as an important resistance is the $0.3000 psychological magnet.
Beyond that, the 50% and 61.8% Fibonacci ratios, respectively near $0.3075 and $0.3490, could test the upside momentum targeting the yearly peak of $0.4341.
Alternatively, a daily closing beneath the 21-day SMA support of $0.2543 could drag Dogecoin to the previous resistance line from August, close to $0.2435.
Even if the DOGE slides past $0.2435 support, a two-month-old support line near $0.2250, the 100-day SMA of $0.2228, and the 200-day SMA around $0.2035 will act as the final defense of the bulls.
Dogecoin Price: Four-Hour Chart Lures Short-Term Sellers

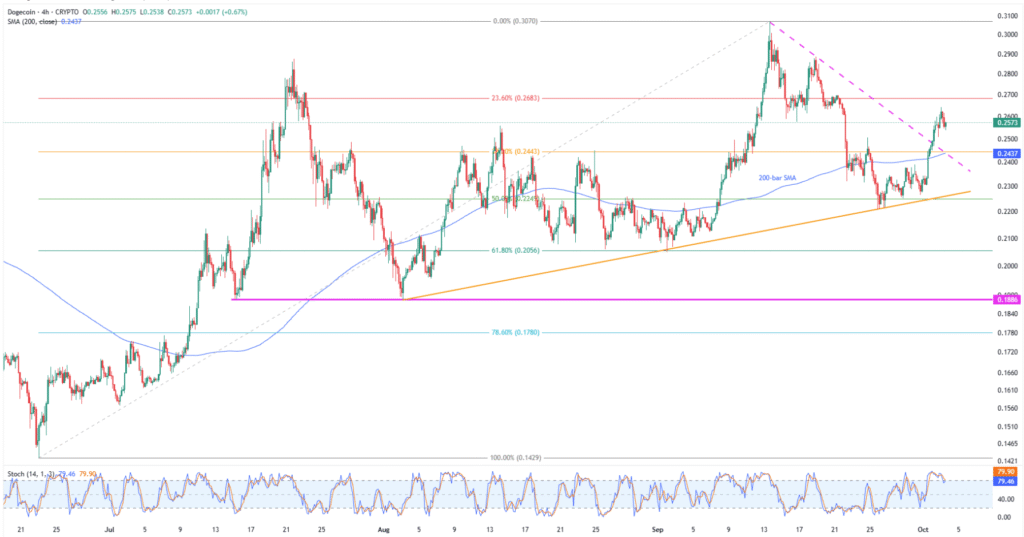
Dogecoin’s four-hour chart shows increased interest, with the Stochastic momentum indicator retreating from overbought levels, signaling a potential short-term pullback in prices.
However, a convergence of the previous resistance line from August and the 200-bar SMA, near $0.2435, becomes the key level to watch for a DOGE bounce.
Should the quote fail to bounce from $0.2435, the ascending trend line from August, near $0.2250, and bottoms marked in July and August, near $0.1890-85, will be the last defense for bulls ahead of highlighting the daily chart’s deeper levels.
On the flip side, the recent peak of around $0.2645 and July’s high of $0.2875 could challenge short-term DOGE bulls before directing them to the higher levels discussed on the daily chart.
Conclusion
Dogecoin’s price action since August appears to be promising for buyers, countering the recent pullback. However, for DOGE to reverse the yearly loss, a strong fundamental catalyst and a clear breakout above $0.2960 are essential.
Also read: What is Crypto Airdrop Farming? Learn How to Earn Free Cryptocurrency!


