- Dogecoin price drops back towards 50-day EMA support, reversing bounce from a one-week low.
- DOGE buyers remain hopeful as price holds above key EMAs and multi-week trendline support, despite slow momentum.
- Bulls keep eyes on seven-month resistance, as long as prices remain above the 200-day EMA.
- A downside break of the 200-day EMA could bring $0.1430 back into focus for bears, potentially targeting the yearly low.
Dogecoin (DOGE) slides over 4.0% to $0.2445 early Thursday, reversing the previous day’s recovery from a week’s low. In doing so, the popular memecoin drops back to the 50-day Exponential Moving Average (EMA) support.
Despite the DOGE’s latest pullback, several key technical support levels and sluggish momentum indicators, like the Moving Average Convergence Divergence (MACD) and Directional Movement Index (DMI), prevent bears from gaining full control.
Dogecoin’s recent weakness is questioned by declining trading volume and a pullback in market cap. Trading volume drops for the second day, following a two-week high, while market cap retreats to a week’s low. According to Santiment, DOGE’s current trading volume is $3.06 billion, with a market cap of $37.53 billion.
On a broader front, the U.S. Dollar’s four-day winning streak and cautious mood ahead of the Federal Reserve (Fed) Chairman Jerome Powell’s speech challenge crypto buyers early Thursday.
Read: Crypto Morning News: Bitcoin Holds at 123K as Gold Tops $4,000, Gaza Truce Lifts Global Mood
Dogecoin Price: Daily Chart Keeps Buyers Optimistic

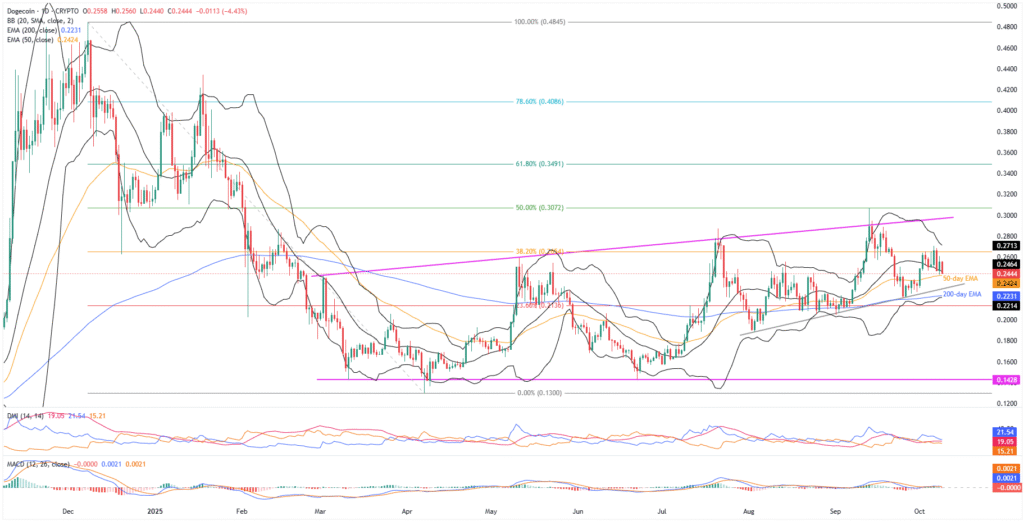
Dogecoin takes offers to reverse the previous day’s rebound from the 50-day EMA, backed by the market’s consolidation ahead of a big event and firmer U.S. Dollar. The downside move, however, lacks support on the daily chart as the MACD signals are mostly sluggish (with smaller green histograms of late), while the DMI suggests a lack of momentum as all three parameters stay beneath the 25.00 neutral mark.
That said, the DMI’s Upmove (D+, Blue) line tops the Downmove (D-, Orange) and the ADX (Average Directional Index, red) line, but stays beneath the 25.00 neutral level, pointing to a weaker upside bias.
With this, the 50-day EMA support of $0.2425 may again challenge the bears; if not, then an ascending support trend line from early August, close to $0.2290, could try stopping the DOGE’s south-run.
In a case where Dogecoin remains weak past $0.2290, the 200-day EMA support near $0.2230, quickly followed by the lower Bollinger Band (BB) of $0.2215, will be the last line of defense for the bulls.
Notably, DOGE’s sustained trading beneath $0.2215 could make the quote vulnerable to slump toward the multi-month horizontal support near $0.1430. During the fall, the $0.2000 threshold and August’s low of $0.1886 might offer breathing space to the bears.
Alternatively, Dogecoin’s recovery can aim for the 38.2% Fibonacci retracement from the December 2024 to April 2025 decline, around $0.2655.
However, the quote’s upside past $0.2655 appears difficult, as the upper BB near $0.2715 and an ascending trend line from March, close to $0.2975, become tough nuts to crack for the buyers. Also acting as an important resistance is the $0.3000 psychological magnet.
Beyond that, the 50% and 61.8% Fibonacci ratios, respectively near $0.3075 and $0.3490, could test the upside momentum targeting the yearly peak of $0.4341.
Dogecoin Price: Four-Hour Chart Lures Short-Term Sellers

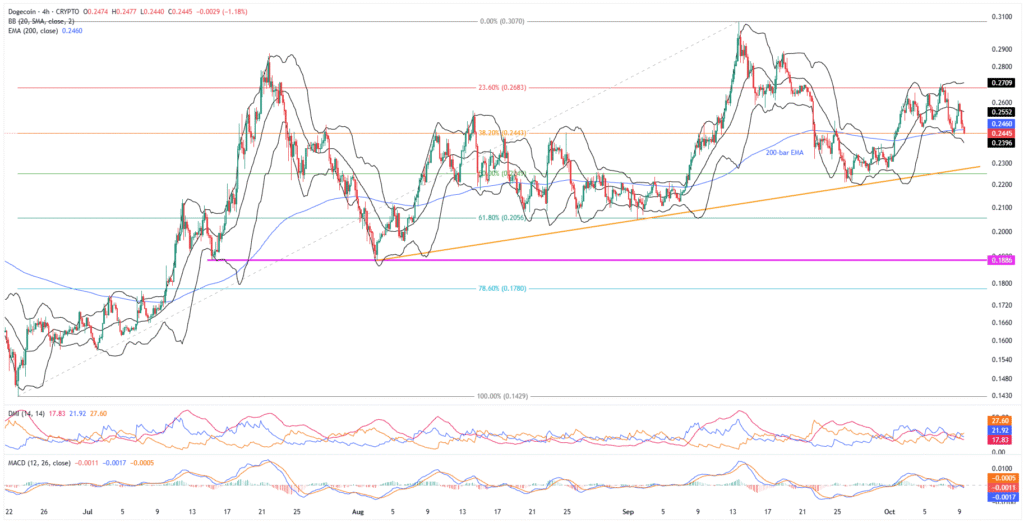
Dogecoin’s four-hour chart shows increased bearish pressure, with the clear bearish MACD signals (red histograms) and the DMI’s Downmove (D-, Orange) line staying firmer beyond the Upmove (D+, Blue) and the ADX (red) lines, while also posting a 25.0+ figure.
However, the DOGE sellers still need a clear downside break of the 200-bar EMA of $0.2460 to approach the lower BB support of $0.2396.
Below that, a two-month ascending support trendline near $0.2290 and deeper levels discussed on the daily chart will be in the spotlight.
Alternatively, Dogecoin’s recovery may initially aim for the middle and the upper BBs, respectively near $0.2552 and $0.2710, before targeting July’s peak of $0.2875 and September’s high of $0.3068.
Should the quote remain firmer past $0.3068, the daily chart’s higher levels could facilitate the buyers in their ruling.
Conclusion
Dogecoin’s price action since August appears to be promising for buyers, countering the recent pullback. However, for DOGE to reverse the yearly loss, a strong fundamental catalyst and a clear breakout above $0.2975 are essential.


