- Dogecoin price remains mildly offered after snapping its two-day winning streak, fading weekend recovery from multi-month support.
- Bearish MACD signals favor DOGE sellers, but nearly oversold RSI highlights key support line.
- 200-day EMA and former support line now pose immediate hurdles to DOGE’s upside.
- Bears can eye $0.1430 on a successful break below $0.1780.
- DOGE looks poised for further downside, but a fresh yearly low remains doubtful.
Dogecoin (DOGE) declines 1.0% to $0.2030 early Wednesday, as bears tighten their grip after snapping a two-day winning streak, reversing the weekend recovery from a multi-month support line.
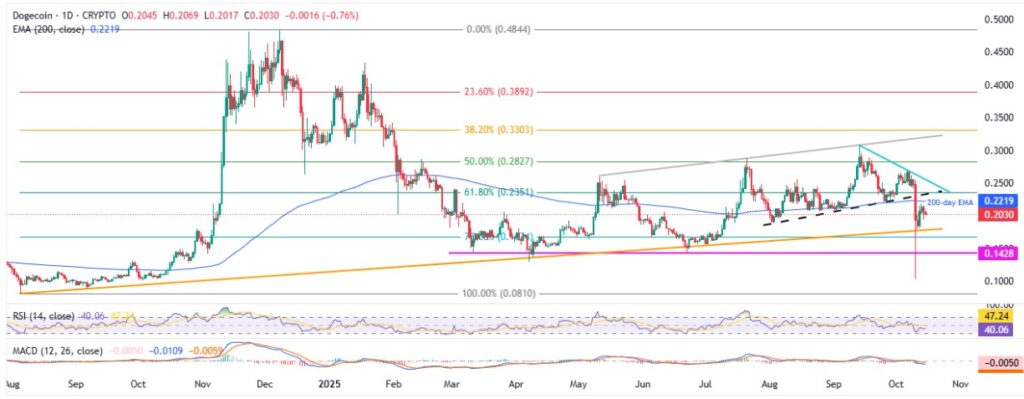
The memecoin’s recent fall portrays a pullback beneath the 200-day Exponential Moving Average (EMA), backed by bearish signals from the Moving Average Convergence Divergence (MACD) momentum indicators.
Meanwhile, downbeat trading volume challenges the DOGE sellers, even as the market capitalization (market cap) drops. That said, Dogecoin’s daily trading volume plummets to a week’s low of $4.18 billion, whereas the market cap declines for the second consecutive day to $30.7 billion by press time, according to Santiment.
Additionally, the nearly oversold 14-day Relative Strength Index (RSI) and an ascending trendline from August 2024 also make it harder for Dogecoin to refresh its yearly low.
With this, the altcoin’s short-term downside looks promising, but a further addition to the yearly losses and a fresh 2025 low looks unlikely. Read Why?
Also read: Top 5 Altcoins to Watch in October 2025
Dogecoin Price: Daily Chart Favors Short-Term Sellers

Dogecoin’s failure to defend a corrective bounce from a multi-month support, portrayed over the weekend, joins the pullback from the 200-day EMA and the bearish MACD signals to direct sellers toward the aforementioned support line from August 2024, close to $0.1780.
The quote’s further downside, however, appears difficult as the RSI is near to the oversold territory of 30.00, currently around 39.95.
This highlights the 78.6% Fibonacci retracement of DOGE’s August-December 2024 upside, near $0.1670, and a seven-month horizontal support near $0.1430 as additional downside filters.
Below that, Friday’s yearly low of $0.1031 and the late 2024 bottom surrounding $0.0805 will be in the spotlight.
On the contrary, the 200-day EMA and a 10-week-old support-turned-resistance, respectively near $0.2220 and $0.2350, could restrict the DOGE’s short-term recovery before fueling prices toward a month-old resistance line around $0.2580.
Should Dogecoin buyers keep reins past $0.2580, as well as cross the $0.2600 threshold, the 50% Fibonacci ratio and an ascending trendline resistance from May, close to $0.2830 and $0.3200, will act as the final defense of the bears.
Dogecoin Price: Four-Hour Chart Highlights Bullish Channel

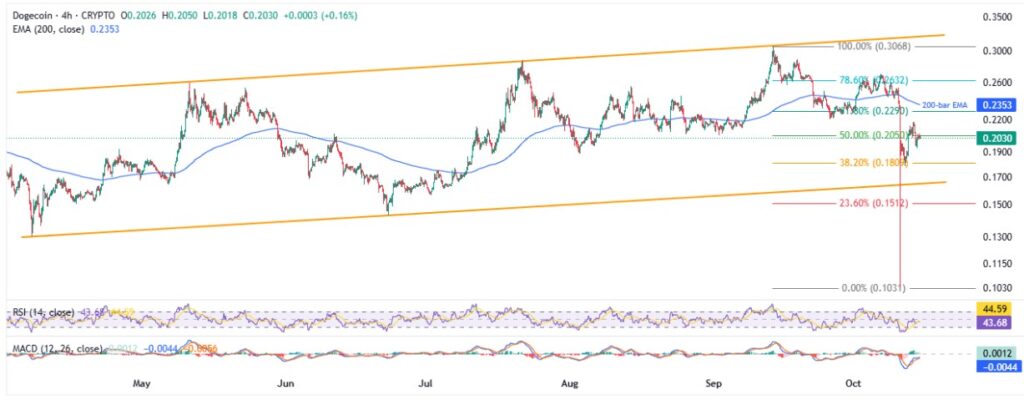
Dogecoin portrays a six-month bullish trend channel on the four-hour chart, currently between $0.1640 and $0.3230, challenging the altcoin’s latest downside bias. Also acting as a short-term trading filter is the 200-bar EMA hurdle of $0.2355.
It’s worth noting that the receding bullish bias of the MACD histograms (easing green bars), contradicts the nearly oversold RSI to challenge the short-term DOGE traders.
Hence, the quote’s trading between $0.1640 and $0.3210 is more likely than a one-sided move.
Conclusion
Dogecoin’s latest fall defends Friday’s break beneath the 200-day EMA, and gains support from the bearish MACD signals, to reinforce the short-term downside outlook. However, nearly oversold RSI conditions and softer trading volume could join a multi-month support line near $0.1780 to challenge the famous memecoin’s further fall. Meanwhile, DOGE’s recovery remains elusive below $0.2600.
Read More: Cryptocurrency Weekly Price Prediction: BTC, ETH & XRP Plummet under U.S. Risk Pressure


