- Ethereum breaks out fortnightly-old trading range, surges to 1.5-month high.
- Clear break of 50-SMA, short-term resistance line favor ETH/USD bulls.
- However, overbought RSI poses a challenge for the buyers.
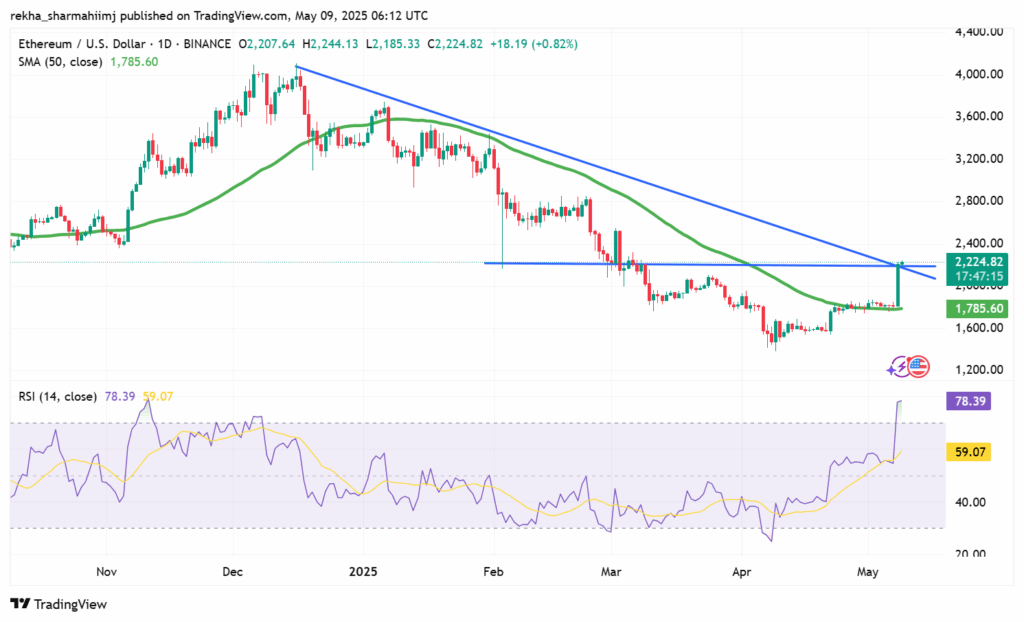
Ethereum (ETH/USD) treads water after surging more than 20% in the previous session. The rally followed a 50-day Simple Moving Average (EMA) breakout and long-term descending trend line to end a two-week trading range.
Technical chart: Daily chart suggests caution ahead

Source: Trading view
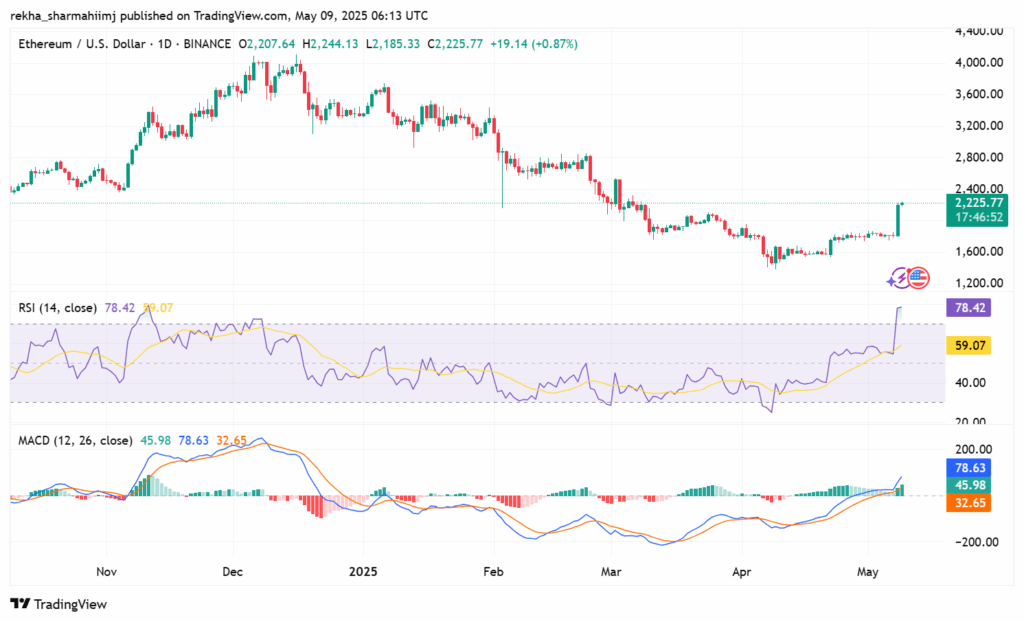
It’s worth noting, however, that Ethereum breaks key resistance, with bullish Moving Average Convergence and Divergence (MACD) signals favoring buyers, but overbought conditions of the Relative Strength Index (RSI) and upcoming hurdles urge caution.
The price stabilizes above $2,220 after a clear upside break of the 50-EMA, by the press time, supported by upbeat RSI and bullish MACD.

Source: Trading view
However, the RSI conditions are close to overbought and hence suggest limited upside room, which in turn hints that the bulls should wait for confirmation for any directional bias from the current level. However, a persistent buying pressure would support the prevailing bullish sentiment. ETH/USD pair expected to touch the high made on May 2, around $2,545.
Next, the bulls would aim for $3,200.
Alternatively, ETH/USD sellers eye a daily close below the 50-SMA of $1,855 to gain control, with a month-old rising trend line close to $1,760 acting as a key support level.


