- Ethereum price defends bullish SMA breakout near two-week high.
- Upbeat momentum indicators point to continued ETH strength toward $2,900.
- ETH pullback may stall around $2,530-15, bearish breakdown unexpected beyond $2,075.
Ethereum (ETH/USD) stays mildly bullish around $2,600 ahead of Thursday’s U.S. session, supported by Wednesday’s breakout above key moving averages near a two-week high. This bullish move is reinforced by upbeat readings from the 14-day Relative Strength Index (RSI) and a positive Moving Average Convergence Divergence (MACD) crossover. With momentum building, ETH now approaches a major resistance zone that could determine whether it can reverse yearly losses.
ETH/USD: Daily chart suggests further recovery

Source: TradingView
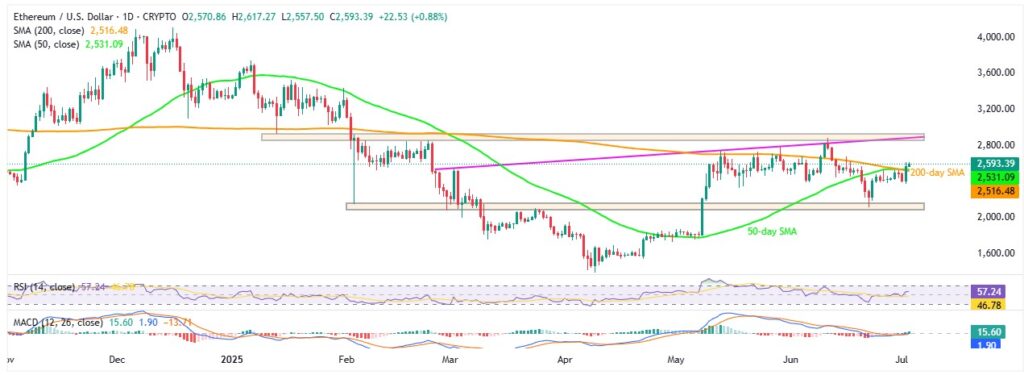
Ethereum stays upbeat early Thursday after a strong breakout above both the 200-day and 50-day Simple Moving Averages (SMAs). The formation of a classic bullish “Golden Cross” — where the 50-day SMA crosses above the 200-day SMA — adds to market optimism. Further backing the bullish bias are a 14-day RSI reading above 50.0 (but not overbought) and positive MACD signals.
This setup supports a potential push toward the immediate resistance at $2,680. However, a tougher challenge lies ahead near $2,850–$2,925 — a zone where a rising trend line from February meets a key horizontal resistance that’s been in place for six months.
If ETH breaks and holds above $2,925, it could open the door for a rally beyond $3,000, with the yearly high near $3,745 back in focus.
On the downside, a daily close below the key SMA zone around $2,530–$2,515 could trigger a slide toward $2,380, and possibly down to the mid-May low near $2,330. Still, strong support sits around $2,150–$2,100 — a zone that’s been holding since early February. If this area breaks, it could increase the risk of ETH revisiting its yearly low, currently near $1,385.
ETH/USD: Four-Hour chart points to short-term inaction

Source: TradingView
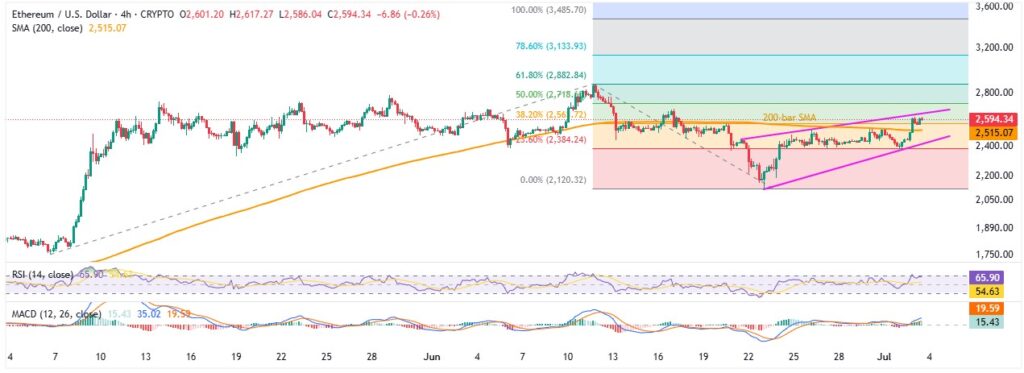
Ethereum’s four-hour chart shows a bearish rising wedge pattern that’s been forming over the past week, keeping price action range-bound between $2,650 and $2,420. The 200-bar SMA, near $2,515, adds another layer of short-term support.
A break below $2,420 could trigger a deeper drop toward the wedge’s theoretical target near $1,900, though intermediate supports like the monthly low around $2,115 and key daily chart levels may slow the fall.
Alternatively, a break above $2,650 could see ETH test the monthly high near $2,880 before facing stronger resistance around the $2,850–$2,925 zone highlighted on the daily chart.
Overall, ETH/USD may stay supported in the short term, but a strong rally beyond the key resistance wall near $2,925 looks less likely for now.


