- Ethereum price crossed multi-year resistance to hit fresh 2025 high, but retreated afterward.
- ETH stays beyond key EMAs, with absence of overbought RSI, to keep bulls optimistic.
- Buyers eye 18-month horizontal resistance, with focus on a daily close above $3,945.
- Bullish trend holds unless ETH breaks below $3,500 support.
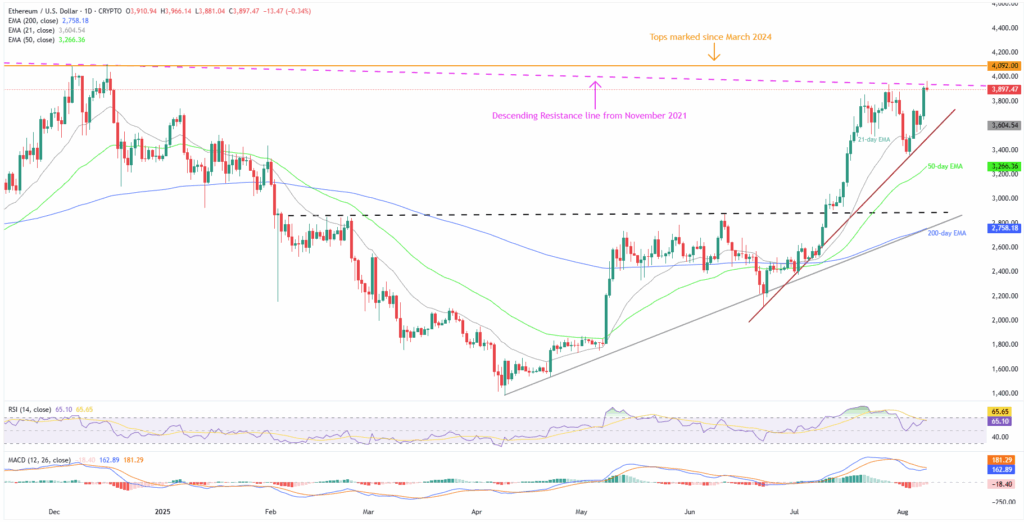
Ethereum (ETH) price retreats to $3,897 early Friday, after piercing a multi-year resistance line to hit a fresh 2025 high around $3,966.
The ETH’s rally could be linked to U.S. President Donald Trump’s signing of an executive order opening the doors of over $12 trillion in retirement funds to investment avenues, including cryptocurrencies. The latest pullback, however, is likely a consolidation phase after the strong rally, potentially setting up the next move higher.
Given Ethereum’s one-week high trading volume, currently around $43.88 billion, backing the latest breakout, the second-largest cryptocurrency is likely to remain firmer. That said, the ETH’s market cap stays around $471.44 billion at the latest, per Santiment data.
Alongside the key resistance breakout backed by the upbeat volume, the ETH’s sustained trading beyond the key Exponential Moving Averages (EMAs) also favors the bullish bias. Furthermore, an impending bull cross on the Moving Average Convergence and Divergence (MACD) indicator, and a 14-day Relative Strength Index (RSI) reading above 50.00, but not in overbought territory, continue to keep buyers optimistic.
Ethereum Price: Daily Chart Suggests Further Upside

Ethereum’s clear rebound from a seven-week support line and 21-day EMA joins the 65.00 RSI print and a potential bull cross on the MACD to underpin upside expectations.
With this, the ETH buyers are likely to defend the early-day breakout of a descending resistance line from November 2021, currently around $3,945.
The same will allow the upside moves to aim for multiple tops marked since March 2024, surrounding $4,100.
It’s worth noting that the RSI might reach the overbought territory of past 70.00 around $4,100 and can offer a pause to the ETH bulls, if not, then the May 2021 high of near $4,381 and the all-time high (ATH) marked in November 2021 around $4,867 will be on their radars. On their way to the north, the $4,200 and the $4,300 thresholds could act as intermediate halts.
Alternatively, a daily closing beneath the aforementioned resistance line near $3,945 might trigger the ETH’s corrective pullback towards $3,730 and the 21-day EMA support of $3,605.
However, an upward-sloping trend line from late June and the 50-day EMA, respectively near $3,500 and $3,266, could challenge Ethereum bears from taking control.
Following that, an ascending resistance-turned-support from February, surrounding $2,885, will challenge the sellers before directing them to the key $2,760-50 support area, encompassing the 200-day EMA and a four-month-old rising trend line.
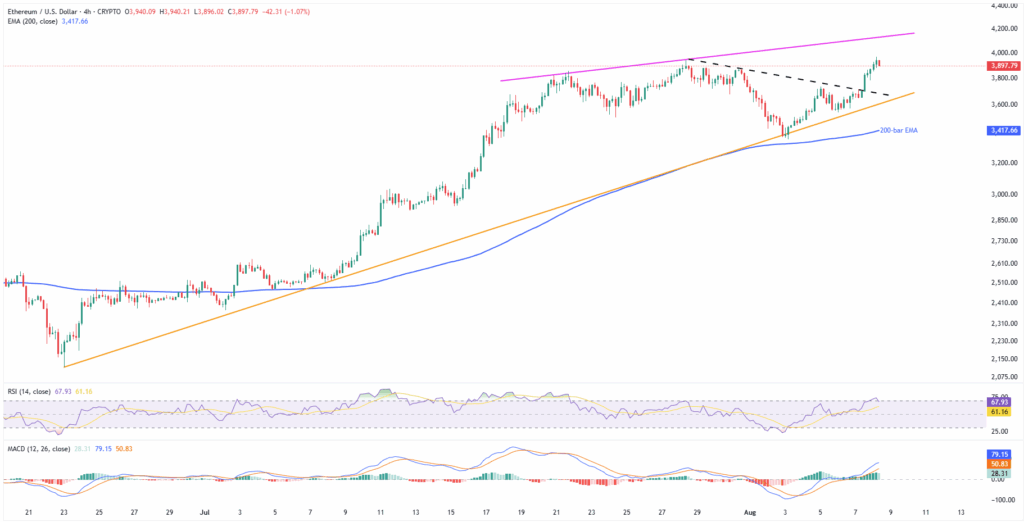
Ethereum Price: Four-Hour Chart Offers Additional Resistance

An upward-sloping trend line from July 20, close to $4,135, acts as an additional resistance on the four-hour projection, apart from the upside levels mentioned on the daily chart.
Meanwhile, a more than a week-long previous resistance line limits the immediate downside of the ETH around $3,680, a break of which will highlight the seven-week-old support line surrounding $3,500 and the 200-bar EMA support of $3,417 for the bears.
In a case where Ethereum sellers keep the reins passed $3,417, the deeper levels discussed on the daily chart will be in the spotlight.
Conclusion
Even if Ethereum buyers pause after breaking the multi-year resistance, the ETH’s sustained hold above key supports, backed by healthy trading volume and strong-but-not-overbought momentum indicators, keeps the door open for further gains.
Also read: Market Roundup: Bitcoin Tops $116K, Gold Gains as Sluggish Dollar Fuels Cautious Optimism


