- Ethereum buyers challenge key resistance at five-month high.
- Overbought RSI, rising trendline from May, and the Golden Fibonacci Ratio test ETH bulls.
- ETH/USD pullback stays dull beyond $2,910, but a sustained rise can target $3,130 and January tops.
Ethereum (ETH/USD) bulls are battling a critical resistance at a five-month high, advancing 3.0% intraday to $3,060 during the initial U.S. session on Monday.
As ETH strives to mirror Bitcoin’s (BTC/USD) stellar surge, it faces resistance from a two-month ascending trendline, key Fibonacci Retracement level, and an overbought 14-day Relative Strength Index (RSI). However, bullish momentum from the Moving Average Convergence Divergence (MACD) indicator and a clear break of the February trendline resistance keep the upside bias intact, limiting sellers’ chances of a return.
ETH/USD: Daily chart lures bulls

Ethereum (ETH/USD) broke above a key trendline from February and hit a five-month high the last week, but failed to clear a two-month resistance. That ceiling—near $3,070—aligns with the overbought RSI and the 61.8% Fibonacci Retracement of the December 2024–April 2025 drop, also known as the “Golden Fibonacci Ratio,” capping immediate upside.
Still, ETH/USD stays bullish above the broken resistance turned support at $2,910, with a strong MACD backing the case for further gains.
If ETH breaks below $2,910, buyers may defend the 200-day Simple Moving Average (SMA) at $2,475 and a horizontal support zone around $2,115–$2,150. A sustained drop below these levels could shift control to the bears.
On the flip side, a daily close above $3,070 could open the door to the January highs near $3,440 and $3,525, with further Ethereum upside targeting the yearly top at $3,743 and the late 2024 peak of $4,105.
ETH/USD: Four-Hour chart highlights upside hurdles

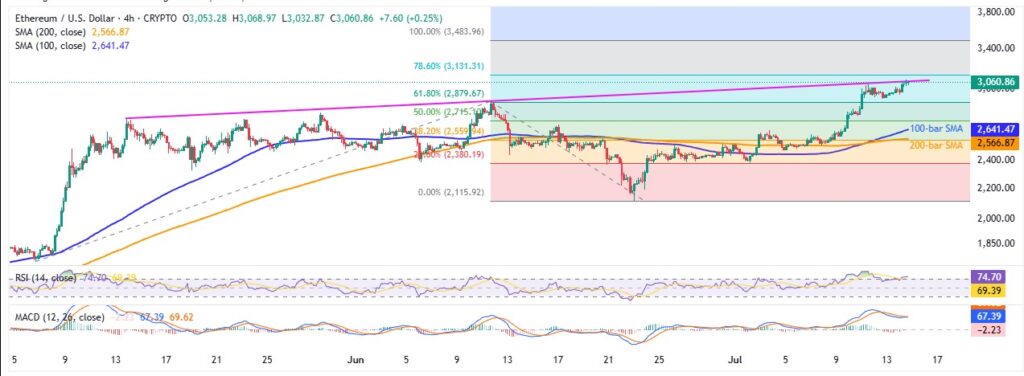
On the four-hour chart, Ethereum (ETH/USD) shows overbought RSI conditions but joins the mixed MACD signals to suggest a short-term pullback toward the $2,910 resistance-turned-support highlighted on the daily chart. Before that, June’s high near $2,880 and the 100-bar and 200-bar SMAs at $2,641 and $2,566, respectively, stand as key barriers to further downside.
Alternatively, a clear move above the $3,070 resistance could trigger a rally toward the 78.6% Fibonacci Extension (FE) of the May–June uptrend around $3,131, before targeting the broader bullish levels outlined on the daily chart.
In summary, ETH/USD faces near-term pullback risk, but the broader uptrend remains intact.


