- Ethereum (ETH) price rebounds from adjacent support to approach $3,950 resistance again.
- ETH holds short-term bullish channel, but overbought RSI and a weak MACD on the daily chart challenge rally hopes.
- Multiple hurdles near $4,100 can test ETH/USD bulls targeting multi-year tops.
- Bears have a long way to return, but a break below $3,130 could boost their chances.
Ethereum price gains 1.5% intraday to $3,865 early Thursday, extending the previous day’s U-turn from a short-term key support.
Along with this, the crypto market optimism following the White House’s “Crypto Policy Report” also allows ETH buyers to brace for a tough fight against the multi-year resistance near $3,950 and a cluster of further hurdles around $4,100.
However, the 14-day Relative Strength Index (RSI) shows overbought conditions, and the Moving Average Convergence Divergence (MACD) indicator signals weakening momentum — suggesting a long and bumpy road towards the north for the ETH/USD bulls.
Daily Chart Suggests Gradual Run-Up

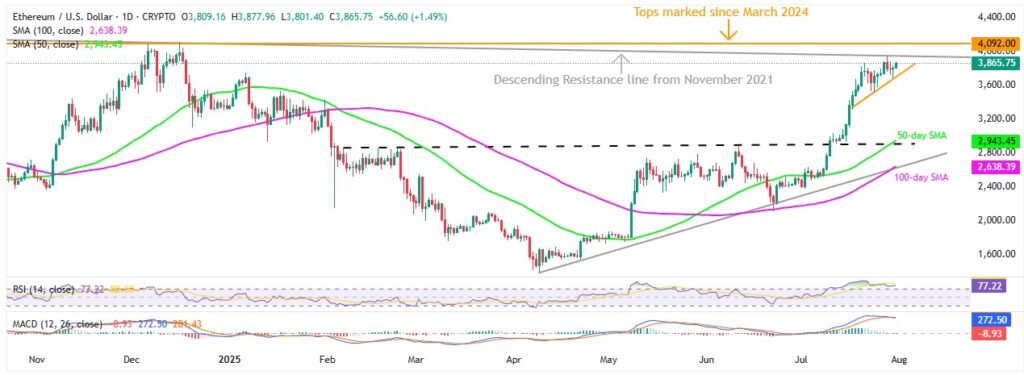
Ethereum buyers are not just riding a successful trading above the two-week-old support—they’re also holding ground after clearing February’s previous resistance and staying above key Simple Moving Averages (SMAs), while trading above an April rising trend line.
However, the overbought RSI and dismal MACD signals warn that the ETH bulls may be losing steam, suggesting possible consolidation near key resistances before a major rally.
That said, the ETH/USD pair currently faces a critical battle at the 2021 resistance line near $3,950, with hopes of breaking through and reaching the $4,000 mark. Following that, tops from March 2024, around $4,100, can challenge the bulls.
If bulls cross the $4,100 hurdle, ignoring momentum indicators, the market’s attention will turn to mid-2021 highs near $4,380 and the all-time peak marked in November 2021 around $4,870, with additional resistances at $4,500 and $5,000 along the way.
Alternatively, Ethereum’s break of the two-week-old support near $3,660 could pull prices down to $3,500 and then to January’s swing high near $3,435. But the $3,000 psychological level, 50-day SMA at $2,945, and February’s former resistance, now turned support near $2,890 would challenge bears from pushing further.
It should be observed that the final line of defense for ETH bulls lies between $2,625 and $2,635, where the 100-day SMA meets the ascending April trend line.
Four-Hour Chart Portrays Bullish Channel

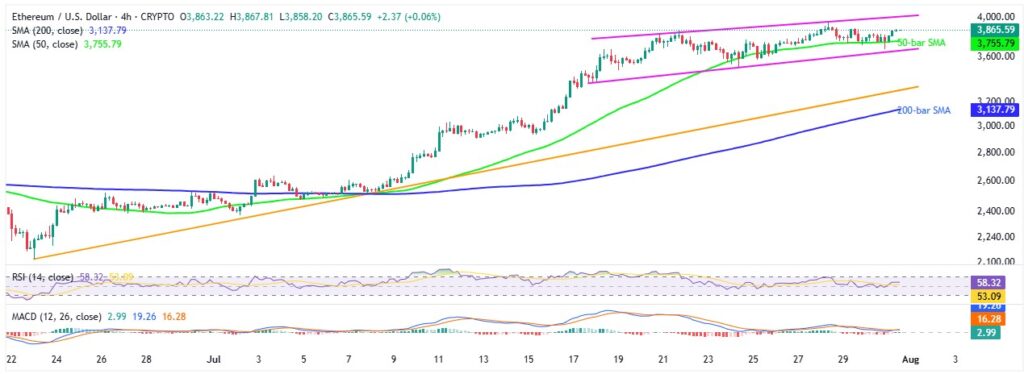
On the four-hour chart, Ethereum portrays a two-week-old bullish trend channel, currently between $3,660 and $4,010, to keep buyers hopeful.
Adding strength to the bullish bias is the ETH/USD pair’s successful trading above the 50-bar SMA support of $3,755, a five-week-old ascending trend line surrounding $3,300 and the 200-bar SMA of $3,137.
Meanwhile, an upside clearance of the $4,010 enables the ETH buyers to aim for the multiple resistances surrounding $4,100 before targeting the higher levels mentioned on the daily chart.
To sum up, Ethereum is likely to stay firm and overcome short-term resistance, even if a major rally remains uncertain.
Also read: Institutional Giant The Ether Machine Buys 15,000 ETH for Ethereum’s 10th Birthday


