- Ethereum price snaps two-day winning streak, slips from a week-long resistance toward 1.5-month-old support.
- Sustained trading beyond key EMAs, upbeat momentum indicators keep ETH buyers hopeful.
- Bulls keep eyes on $4,090, while sellers should remain cautious beyond $2,880.
- ETH’s four-month uptrend remains intact despite a short-term pullback, and a slow recovery is anticipated.
Ethereum (ETH) price drops 1.80% intraday to $3,652 during Tuesday’s European session, facing the first daily loss in three amid crypto market consolidation.
In doing so, the ETH bulls retreat from a week-long descending resistance line, while reversing prior recovery from a 1.5-month-old ascending trend line support. Even so, the quote’s gradual run-up since April remains in place.
Along with the ability to keep a broader rebound, an absence of bearish signals from the 14-day Relative Strength Index (RSI) also keeps the Ethereum buyers hopeful. However, the Moving Average Convergence Divergence (MACD) indicator reveals fading bullish momentum, suggesting the need for a cautious outlook.
Ethereum Price: Daily Chart Highlights Cautious Bullish Bias

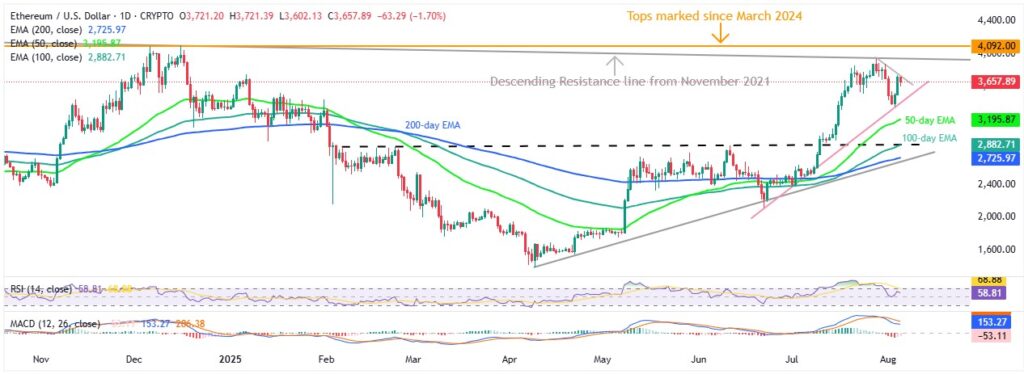
Despite the latest pullback from a week-long resistance, close to $3,735 by the press time, the price maintains its gradual recovery from April. The upside bias also gains support from the near 50.0 RSI line and the quote’s sustained trading beyond the key Exponential Moving Average (EMA).
With this, Ethereum buyers are likely to overcome the immediate $3,735 hurdle while aiming for the multiple tops marked since March 2024, surrounding $4,090. Still, a downward-sloping resistance line from November 2021, close to $3,950, as well as the $4,100 threshold, could act as additional challenges for the ETH bulls
.
Alternatively, a daily closing beneath the rising trend line from June 22, near $3,470, can trigger a short-term downtrend of the ETH.
The same highlights the 50-day EMA support of $3,196 and a convergence of the 100-day EMA and previous resistance line from February, around $$2,880. It should be noted that the 200-day EMA and an ascending trend line from April, respectively near $2,725 and $2,680, will be the last defense of the Ethereum sellers.
Ethereum Price: Four-Hour Chart Appears More Bullish

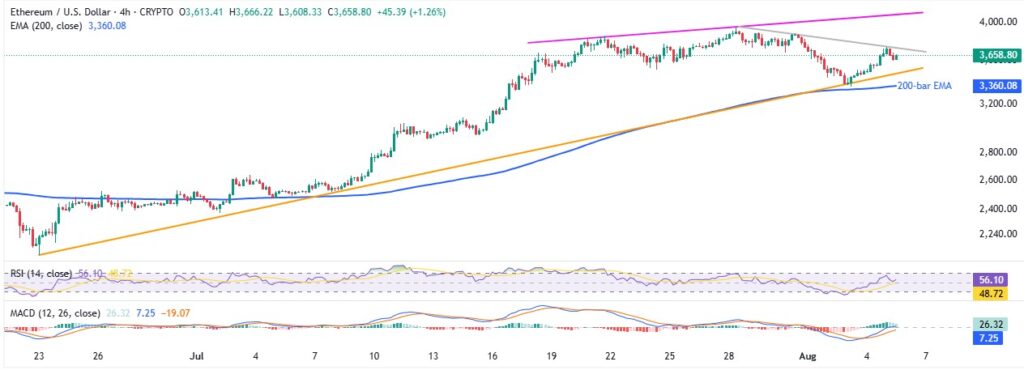
While the ETH’s daily chart suggests a gradual run-up, the four-hour chart projects stronger upside moves with comparatively stronger RSI, MACD, and the quote’s sustained trading beyond the key EMAs.
That said, Ethereum buyers appear well-set to cross the immediate $3,735 hurdle, which in turn will allow it to challenge the yearly high of $3,941.
However, an upward-sloping resistance line from July 20, also coinciding with the multiple tops marked since March, highlights the $4,090 as the key upside barrier for the ETH bulls to watch.
On the flip side, a downside break of the immediate $3,470 support will have another chart to revive due to the presence of the 200-bar EMA support of $3,360. Following that, Ethereum’s downside toward the deeper levels discussed on the daily chart can’t be ruled out.
Conclusion
Despite the latest retreat from an immediate resistance, Ethereum stays firmer past a six-week-old support, as well as carries a four-month uptrend. The same joins mostly upbeat RSI and MACD conditions, together with a successful trading beyond the key moving averages, to suggest further upside of the second-biggest cryptocurrency.
Also Read: Will Ethereum(ETH) Test $4,000 in August? This Analyst Shows the Data!


