- Ethereum price stalls after consecutive two-week & two-day uptrends, stuck in bearish patterns of late.
- Rising wedges on daily and four-hour charts, plus mixed momentum, challenge ETH bulls at 200-day SMA.
- Selling may accelerate below $2,360, with $2,100 as key support and $2,910 capping any recovery.
- A break under $2,515 could trigger short-term consolidation in the ETH/USD pair.
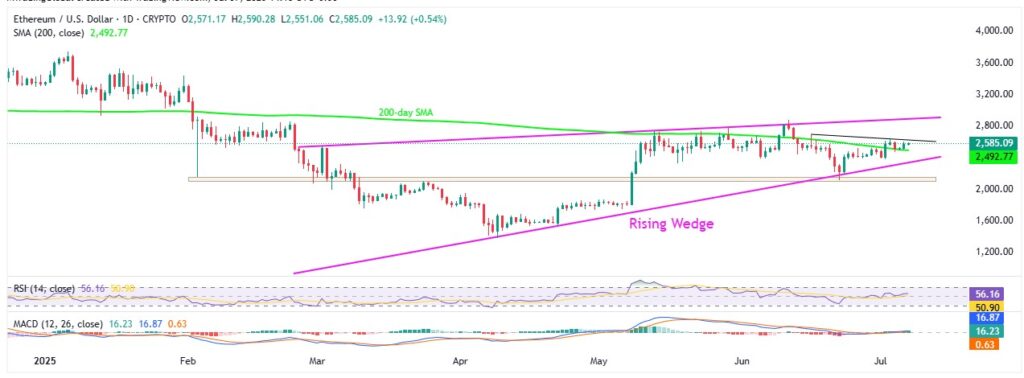
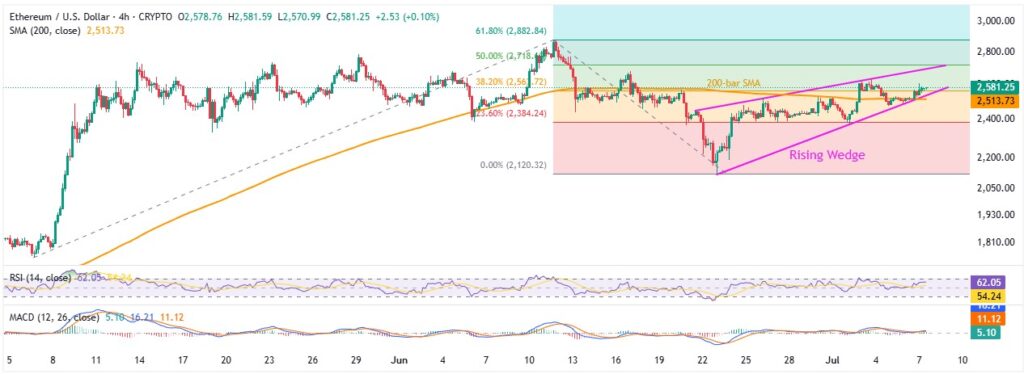
Ethereum (ETH/USD) holds steady around $2,570 in Monday’s European session, after back-to-back daily and weekly gains. However, the second-largest cryptocurrency is now moving sideways within a Rising Wedge — a bearish chart pattern visible on both the daily and four-hour charts — while struggling to maintain its rebound from the 200-day Simple Moving Average (SMA).
Meanwhile, the 14-day Relative Strength Index (RSI) stays neutral, and the Moving Average Convergence Divergence (MACD) signals remain mixed, reflecting weakening momentum. A lack of direction suggests a potential pullback, especially if triggered by fresh fundamentals or in anticipation of the upcoming “Crypto Week” starting July 14.
ETH/USD: Daily chart shows bullish fight inside bearish setup

Source: Tradingview
Even though Ethereum (ETH/USD) prices fluctuate within a Rising Wedge bearish pattern dating back to late February, trading steadily above the 200-day SMA keeps buyers optimistic. The 14-day RSI sits near 56.00, and the MACD shows mild bullish signals, pointing to a slow upward grind that needs fundamental support to convince buyers.
However, immediate upside faces a three-week-old descending resistance line around $2,625, followed by the wedge’s upper boundary near $2,910. A break above $2,910 would invalidate the bearish pattern, opening the path for buyers to test the $3,000 mark and then January highs at roughly $3,440, $3,525, and $3,745.
On the downside, a daily close below the 200-day SMA support at $2,492 would push sellers toward the wedge’s support at $2,348.
A break below this would confirm the bearish pattern, targeting a theoretical low near $855. Between these levels, the ETH/USD bears could find support zones around $2,150-$2,100, the $2,000 mark, and the yearly low near $1,385.
ETH/USD: Four-Hour chart appears more interesting

Source: Tradingview
On the four-hour chart, Ethereum is narrowing within a three-week Rising Wedge pattern, currently ranging between $2,700 and $2,535. The 200-bar SMA at $2,513 acts as critical support — a break below this could open the door to a theoretical drop toward the $2,000 mark before aligning with key daily chart levels.
To the upside, a breakout above $2,700 would shift focus to the previous monthly high near $2,880, which stands as the next major resistance before ETH/USD eyes higher targets on the daily chart.
Interestingly, the four-hour RSI and MACD indicators are showing stronger bullish momentum, suggesting a gradual move higher is more likely — even as the rising wedge continues to test buyer conviction.
Overall, ETH/USD leans bullish above the 200-bar SMA, despite the wedge pattern applying short-term pressure on buyers.


