- Ethereum price refreshes 2025 peak during nine-day uptrend.
- Overbought RSI can test ETH bulls, but breakout momentum and strong demand keep upside hopes alive.
- ETH/USD bears stay sidelined above $2,930; bulls eye $4,110 to test record highs.
Ethereum (ETH/USD) jumps 1.8% intraday to $3,830 during Monday’s European session, firmly defending its impressive nine-day winning streak as bulls post the year’s high. The price hovered close to the seven-month high marked on Sunday during early day, as bulls await fresh catalysts to fuel further upside, but overall crypto optimism recently fuelled the upside momentum.
The sustained demand for the ETH/USD pair during the so-called ‘crypto week’ has helped it break key resistance levels and hit a new yearly high. However, the rally now faces a potential speed bump, as the 14-day Relative Strength Index (RSI) signals overbought conditions—posing a challenge for bulls as they eye the next major upside barriers.
ETH/USD: Daily Chart Points To Bumpy Road for Bulls

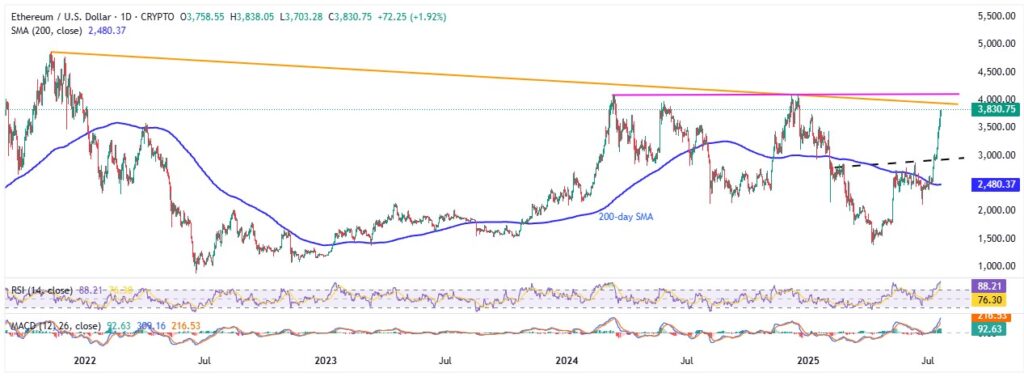
Ethereum remains supported by a clean breakout above the five-month resistance-turned-support at $2,930 and sustained trade above the 200-day Simple Moving Average (SMA) near $2,480. The Moving Average Convergence Divergence (MACD) also favors bulls, while a recent breakout above January’s high and former yearly top at $3,743 adds to the strength—even as the 14-day RSI flashes overbought conditions.
As long as ETH holds above $3,743, the rally could extend toward a falling resistance line from November 2021 near $3,955, followed by the 16-month horizontal resistance zone between $4,090 and $4,105. A sustained break above $4,105 could open doors to the all-time high near $4,733, with the psychological $4,000 level acting as a key magnet along the way.
Alternatively, a break below $3,743 may drag ETH toward the mid-January high near $3,525 and February’s peak at $3,438. However, bearish momentum is unlikely unless ETH clearly breaks below both the $2,930 support and the 200-day SMA at $2,480, with the $3,000 mark serving as a key downside filter.
ETH/USD: Four-hour Chart Points To Bullish Exhaustion

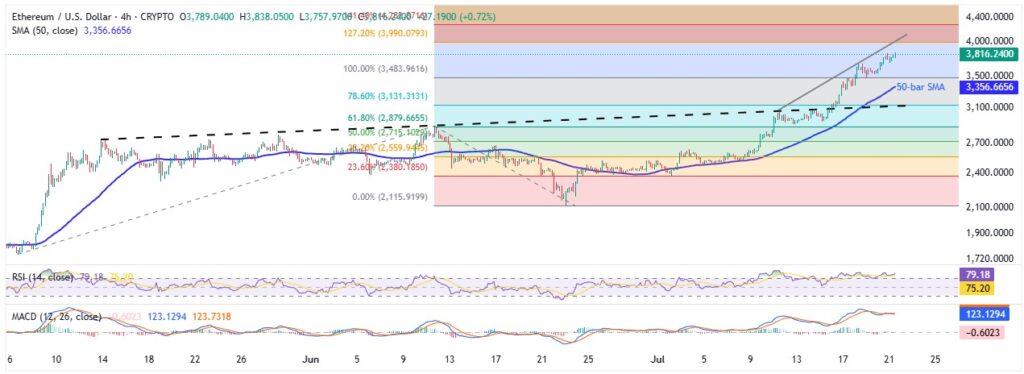
On the four-hour chart, Ethereum confirms bullish momentum with a breakout above the nine-week resistance-turned-support near $3,100, and sustained trading above the 50-bar SMA. However, the overbought RSI and mixed MACD signals hint at a possible short-term pullback.
In case of a dip, immediate support lies at the 100% Fibonacci Extension (FE) of the May–June move near $3,483, followed by the 50-bar SMA around $3,355, and then the key $3,100 zone.
On the upside, a rising trend line and the 127.20% FE level converge around $3,990, just ahead of the $4,000 psychological barrier. A firm break above this region could shift attention back to the daily chart resistance levels and the all-time high near $4,733.
Bottom line: Despite short-term pullback risks due to overbought RSI, ETH bulls maintain control, with $4,000 still within reach.


