- Ethereum price slips beneath 10-day SMA to hit a week’s low, extends pullback from multi-year peak.
- SMA break, bearish MACD signals direct ETH sellers toward the highs formed since March 2024.
- Lack of overbought RSI and strong support levels limit chances of a bearish ETH reversal.
- ETH’s drop toward $3,850 poses little threat to buyers, even in the short term, despite ongoing consolidation.
Ethereum (ETH) drops over 3.0% intraday to $4,336, after hitting the lowest level since August 12, heading into Monday’s U.S. trading session.
The ETH’s latest fall takes clues from a downside break of the 10-day Simple Moving Average (SMA), and a bearish sign from the Moving Average Convergence Divergence (MACD) indicator.
Still, multiple downside support levels and a pullback in the 14-day Relative Strength Index (RSI) from overbought territory to a healthy bullish range, between 50.0 and 70.0, challenge the Ethereum bears from taking control.
Notably, Monday’s daily trading volume jumps to a three-day high of $47.94 billion, according to Santiment, whereas the market cap also declines to a week’s low of $514.85 billion. Both these figures suggest active selling pressure in the market.
Ethereum Price: Daily Chart Points To Short-term Pullback

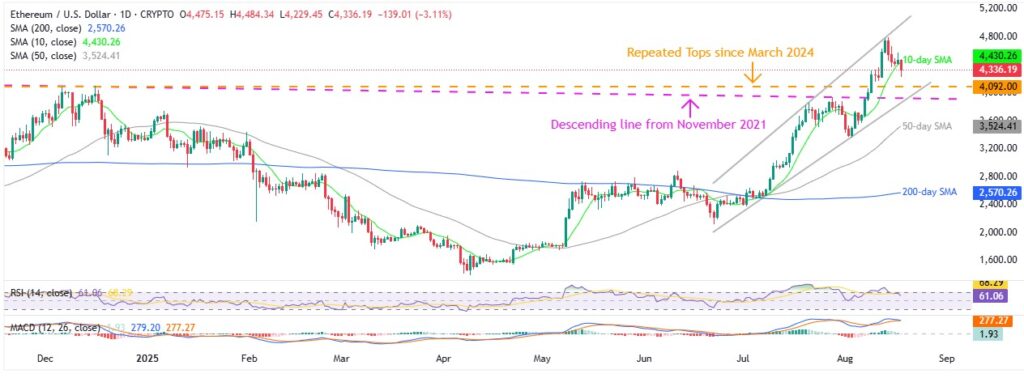
Ethereum’s downside break of the 10-day SMA joins the bearish MACD signal to direct sellers toward the key support zone near $4,090, comprising multiple tops marked since March 2024.
However, a descending trend line support from November 2021, surrounding $3,930, quickly followed by a six-week-old rising support line, near $3,850, could limit the ETH’s further downside.
In a case where the quote remains weak past $3,850, it becomes vulnerable to visit the 50-day and 200-day SMA supports, respectively, near $3,520 and $2,570, with the $3,000 threshold and June’s peak of $2,880 likely acting as intermediate halts.
Meanwhile, Ethereum’s recovery remains elusive below the 10-day SMA of $4,423, a break of which could allow it to reach the latest peak surrounding $4,790 and an upward-sloping resistance line from July, near $4,980.
Notably, the $5,000 psychological magnet is also a widely talked-about resistance for the ETH.
Additionally, the altcoin’s all-time high (ATH) marked in November 2021, around $4,867, might also test the bulls.
Ethereum Price: Four-Hour Chart Highlights Multiple Supports

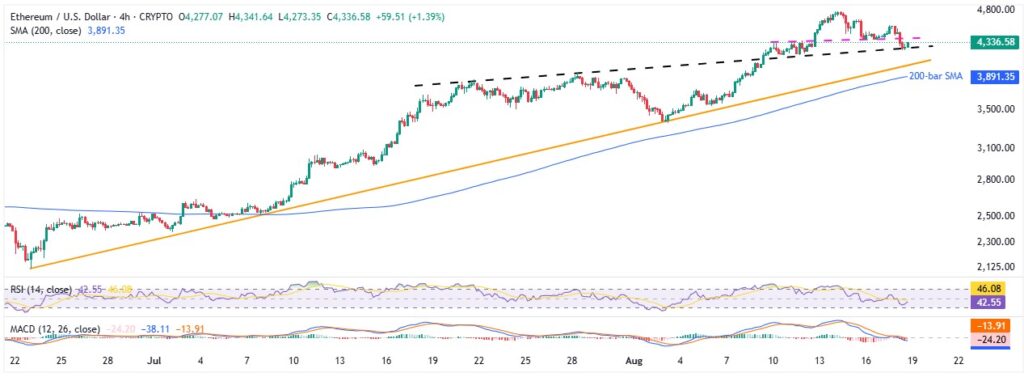
Ethereum’s four-hour chart portrays multiple support levels to challenge the immediate downside, especially when the RSI suggests exhaustion in bearish momentum.
Among them, a month-old resistance-turned-support guards nearby ETH downside around $4,250.
Below that, an ascending trend line from June 23 and the 200-bar SMA, close to $4,020 and $3,890 in that order, will act as the final defense of the buyers ahead of highlighting the deeper levels discussed on the daily chart.
Meanwhile, a week-long previous support line guards the immediate ETH upside near $4,400; a break of the mentioned level could allow buyers to aim for the four-year high marked last week around $4,790 and the daily chart levels.
Conclusion
Ethereum’s recent break below the short-term SMA and bearish MACD signals confirm near-term downside pressure. Still, the overall uptrend remains strong unless it breaks the key $3,850 support.


