- Ethereum jumps to the highest level since December 2021, extending Tuesday’s rally.
- ETH’s push beyond Bollinger Band and overheated momentum indicators suggest mild pullback in price.
- Breakout of key resistances keeps buyers hopeful of challenging the record high marked in 2021.
- Ethereum’s rally appears overheated, signaling a potential price consolidation, but the broad bullish trend remains intact.
Ethereum remains firmer at the highest level since December 2021 on Wednesday, despite retreating from $4,680 to $4,611 by press time.
The ETH’s latest run-up justifies the previous day’s breakout of a two-month resistance line, now support, while building on the early August clearance of multi-month hurdles and a successful trading beyond the key Simple Moving Averages (SMA).
Furthermore, Ethereum’s six-month high trading volume, according to Santiment, reached $63.35 billion, and its highest market cap since November 2021, close to $557.87 billion, adds strength to the upside bias surrounding the second-largest cryptocurrency.
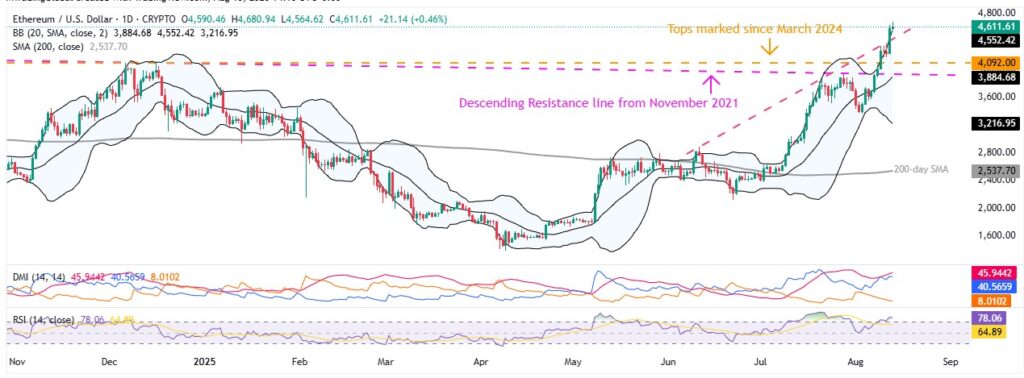
Still, the ETH’s push beyond the upper Bollinger Band (BB) and overbought conditions of the 14-day Relative Strength Index (RSI) suggest a short-term consolidation in the price. However, the Directional Movement Index (DMI) suggests notable strength of the overall bullish trend, defending the long-term buyers.
Ethereum Price: Daily Chart Signals Consolidation

While hitting a multi-year high, Ethereum sneaks out of the upper Bollinger Band (BB) and posts the 78.00 RSI line, suggesting the buyer’s overheating conditions. However, the Directional Movement Index (DMI) is way above the 25.0 neutral limit, and the Upmove line (Blue) is close to the Average Directional Index (ADX) line (Red), suggesting the broad strength of the broad bullish trend.
With this, the ETH’s pullback towards the upper BB, close to $4,555, appears imminent. However, the resistance-turned-support line from June, near $4,430, could challenge the sellers afterward.
In a case where the Ethereum price remains weak past $4,430, the tops marked since March 2024 and a descending trend line from November 2021, respectively near $4,090 and $3,925, will gain the bear’s attention.
Above all, ETH bulls keep the reins unless the price drops beneath the lower band of the Bollinger, around $3,213, and the 200-day SMA support of $2,537.
Alternatively, an upside clearance of the latest peak surrounding $4,680 could direct the altcoin’s all-time high (ATH) marked in November 2021 around $4,867, quickly followed by the widely-discussed bullish target for the ETH, namely the $5,000 mark.
Ethereum Price: Four-Hour Chart Portrays Overheated Markets

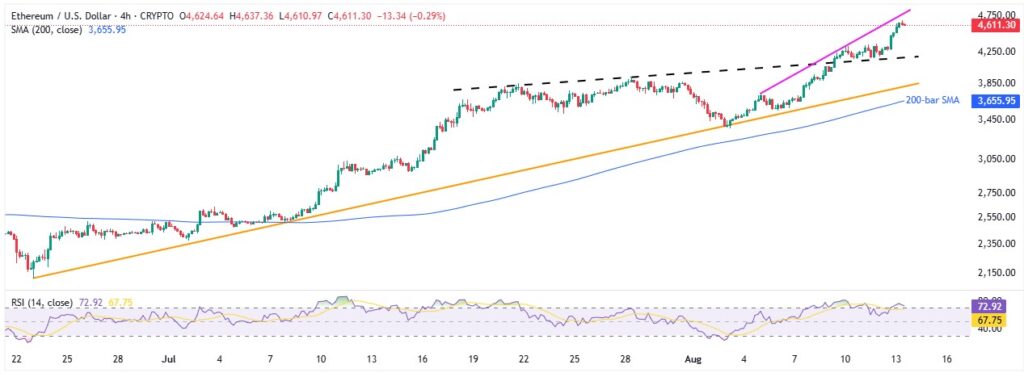
The overbought RSI conditions and nearness to a week-long resistance highlights the odds of witnessing Ethereum’s pullback on the four-hour chart.
This shifts the market’s attention towards a three-week-old previous resistance surrounding $4,190.
However, an ascending trend line from late June, close to $3,820, and the 200-bar SMA level near $3,655, will be the key levels to watch the ETH bears if they’re planning to retake control, even for the short-term.
Alternatively, a week-long resistance line guards Ethereum’s immediate upside near $4,800, a break of which will highlight the ATH of $4,867 and the $5,000 threshold.
Conclusion
Ethereum’s break above the upper Bollinger Band and overbought RSI point to a possible short-term pullback in prices. However, the DMI indicator signals a strong uptrend and joins the ETH’s sustained trading above the key resistances to support the overall bullish bias.
Also read: Legendary Trader AguilaTrades Makes Bold Move, Flips from Short to Long on ETH


