- Ethereum price struggles to remain firmer after hitting 3.5-year high.
- ETH faces pullback risks as two-month resistance, overbought RSI, and Sunday’s Doji candlestick flash warning signs.
- Strong supports can test ETH bears before $2,800, bulls may target $4,500 on crossing the $4,380 hurdle.
- ETH’s short-term consolidation appears overdue, but the broader bullish trend remains intact.
Ethereum (ETH) price remains mildly bid around $4,250 during Monday’s European session, retreating from the highest level since December 2021 marked earlier in the day.
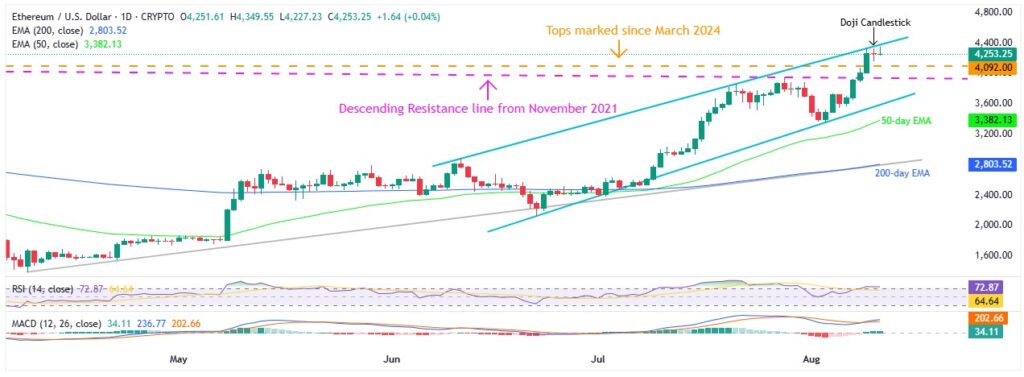
The ETH price eases beneath an upward-sloping resistance line from June 11, pressured by the overbought conditions of the 14-day Relative Strength Index (RSI). Also favoring the pullback bias could be Sunday’s ‘Doji’ candlestick on the daily chart.
Still, bullish signals from the Moving Average Convergence Divergence (MACD) indicator and last week’s successful breakout of multi-year resistance lines underpin upside bias surrounding the second-largest cryptocurrency.
That said, the ETH’s trading volume remains moderate, around $35.93 billion, while the market capitalization holds the highest level since late 2021, close to $514.78 billion at the latest.
Ethereum Price: Daily Chart Suggests Imminent Pullback

Sunday’s ‘Doji’ candlestick, overbought RSI conditions, and failure to cross an upward-sloping resistance line from June 11, close to $4,380 by the press time, together trigger Ethereum’s retreat from the highest level since late 2021.
This highlights the $4,090 horizontal support, previous resistance, comprising tops marked since March 2024, and a descending resistance-turned-support from November 2021, close to $3,935 at the latest. However, a seven-week-old rising support line surrounding $3,580 could challenge the ETH bears afterward.
In a case where the Ethereum price defies a two-month bullish trend channel, currently between $3,580 and $4,380, its fall to the 50-day Exponential Moving Average (SMA) surrounding $3,380 and then to the $3,000 threshold can’t be ruled out.
However, a convergence of the 200-day EMA and a four-month rising trend line, around the $2,800 threshold, acts as the final defense of the ETH buyers.
Meanwhile, an upside clearance of the $4,380 resistance also gains strength from the May 2021 peak of $4,381, a break of which could propel prices toward the $4,500 threshold and then to the all-time high (ATH) marked in November 2021 around $4,867.
Should the Ethereum buyers keep the reins past $4,867, the $5,000 psychological magnet will be on their radar.
Ethereum Price: Four-Hour Chart Highlights Recovery Points

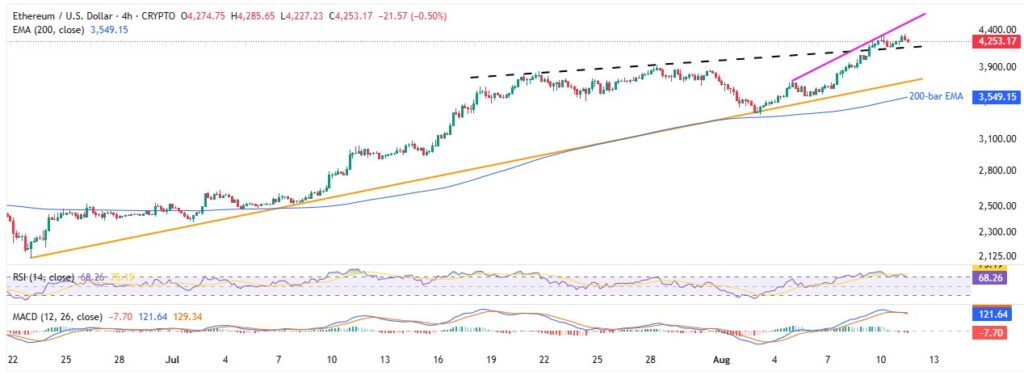
Unlike the daily chart, the ETH’s four-hour chart highlights multiple downside supports, with more open room towards the north, to keep buyers hopeful even if the short-term pullback is imminent.
It’s worth noting that the RSI returns on the normal 50-70 area in the four-hour chart and MACD signals are also sluggish, suggesting a continuation of a slow upside move.
With this, the Ethereum sellers are approaching a three-week support surrounding $4,170, the previous resistance. Following that, the $4,000 threshold, an ascending trend line from late June, near $3,750, and the 200-bar EMA near $3,550 could entertain the bears before driving them to the deeper levels mentioned on the daily chart.
Alternatively, the ETH rebound may aim for the latest peak surrounding $4,350 before targeting $4,380 and other resistances discussed on the daily chart. It should be noted that a week-long resistance line surrounding $4,530 could also gain the buyer’s attention.
Conclusion
Ethereum’s strong breakout and positive momentum indicators support its overall bullish trend. However, an overbought RSI, stalled resistance, and a ‘Doji’ candlestick signal a likely short-term consolidation in the prices of the second-biggest cryptocurrency.
Also read: Market Digest: Bitcoin Hits $121K Amid Global Peace Negotiations


