- Ethereum price declines more than 2.0% after breaking a three-week-old support line.
- Bearish MACD signals and neutral RSI keep ETH sellers hopeful of approaching the key $4,200 support level.
- Multiple support levels and strong Ethereum fundamentals limit downside bias, challenging hopes of heavy bearish moves.
- ETH’s short-term downside looks promising, but the broader bullish trend could prevail unless bears break the 200-day SMA.
Ethereum (ETH) price drops more than 2.0% intraday to $4,411 early Friday morning in New York.
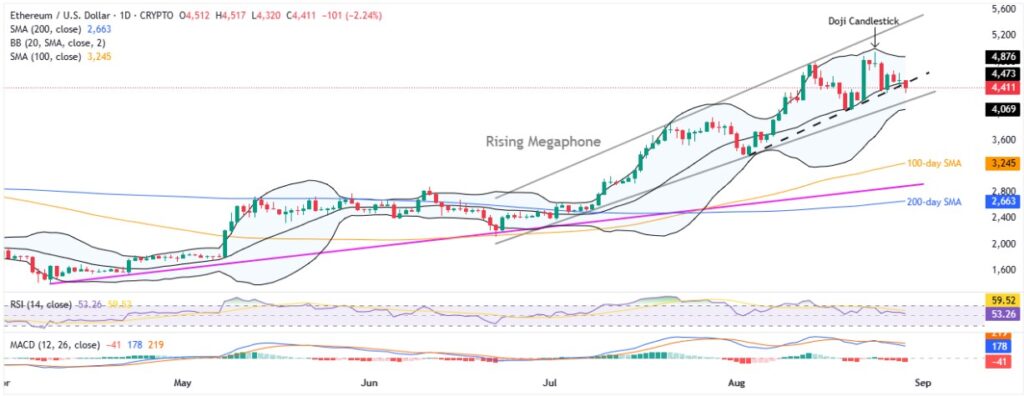
In doing so, the second-largest cryptocurrency justifies the downside break of a three-week support and bearish signals from the momentum indicators like Moving Average Convergence Divergence (MACD) and the 14-day Relative Strength Index (RSI).
A jump in the daily trading volume, after a three-day easing pattern, also favors the ETH sellers. According to Santiment, Ethereum’s daily trading volume increased for the first time in four days at $41.14 billion by press time. The market capitalization (market cap) slipped to $526.17 billion in the past 24 hours.
Even if the ETH appears well-set for further downside in the next two to three days, a multi-week “Rising Megaphone” chart pattern and the Ethereum blockchain’s fundamental strength seem to be challenging the bears from taking control
Also read: Here’s Why Crypto Analyst Predicts ETH Can Test $4,800!
Ethereum Price: Daily Chart Favors Gradual Recovery

Ethereum’s clear break of a three-week support line joins bearish MACD signals and neutral RSI line, close to the 50.00 level, suggests a continuation of the short-term downside. Adding strength to the bearish bias is Sunday’s Doji candlestick at the record top.
With this, ETH appears well-set to drop towards the bottom line of a seven-week-old “Rising Megaphone” trend-broadening chart pattern, currently around $4,200.
However, the quote’s further weakness appears doubtful, which, if it happens, will be challenged by the lower Bollinger Band (BB) surrounding $4,060 and the $4,000 round figure.
In a case where the quote remains bearish past $4,000, the 100-day SMA and a rising trend line from early April, respectively near $3,245 and $2,900, could lure the ETH sellers.
Above all, the 200-day SMA level of $2,662 appears to be the last line of defense for the ETH buyers.
On the contrary, Ethereum’s recovery could aim for the support-turned-resistance line from early August, coinciding with the middle BB near $4,475.
Beyond that, the August 17 swing high of $4,577 and the early-month peak of $4,782, as well as Sunday’s ATH of $4,954 and the $5,000 psychological magnet, will gain the market’s attention.
Notably, the quote’s sustained trading beyond the $4,954 level will defy the bearish candlestick formation and allow buyers to aim for a fresh record high, highlighting the $5,000 round figure, as well as an ascending trend line forming part of a multi-month trend-broadening chart pattern, close to $5,400 at the latest.
Ethereum Price: Four-Hour Chart Appears More Interesting

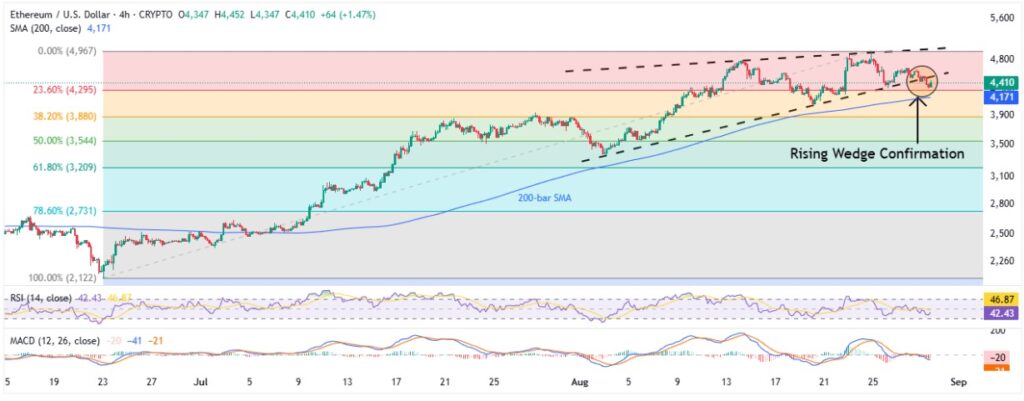
On the four-hour chart, the confirmation of a “rising wedge” bearish chart pattern contrasts with the nearly oversold RSI, which is challenging ETH bears. Further downside in the altcoin’s price is limited by the 200-bar SMA support around $4,170.
It’s worth noting that the quote’s failure to bounce off the 200-bar SMA could direct it towards the rising wedge confirmation’s theoretical target of $2,920. During the anticipated fall, the daily chart levels could offer intermediate halts to the bears.
An upside break of $4,535 will defy the rising wedge confirmation and allow the ETH buyers to aim for the all-time high (ATH) surrounding $4,955. Beyond that, the $5,000 threshold and the higher levels discussed on the daily chart could lure the ETH bulls.
Conclusion
Ethereum is likely to carry its latest breakdown for a short-term (2-3 days), backed by strong volume and bearish momentum indicators. However, traders should remain cautious of both bullish breakouts and downside risks, even if it’s broad uptrend is likely to prevail.


