- Ethereum extends week-start pulls back from key SMA confluence.
- Upbeat RSI and MACD join “Golden Cross” to suggest a move above $2,540.
- ETH also faces resistance at $2,885 and $2,925 before aiming for $3,000, pullback remains elusive beyond $2,100.
Ethereum (ETH/USD) posts its second daily loss, extending Monday’s pullback from a key moving average confluence, falling to $2,460 during Tuesday’s European trading hours. Still, a positive 14-day Relative Strength Index (RSI), bullish Moving Average Convergence Divergence (MACD), and a bullish moving average crossover keep buyers cautiously optimistic.
ETH/USD: Daily chart hints at further upside

Source: TradingView
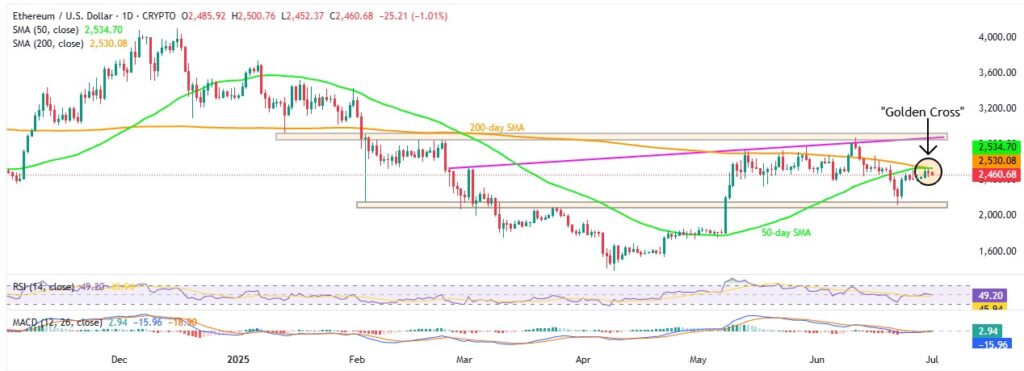
With the 14-day RSI near the neutral 50.00 level and the MACD showing bullish momentum, ETH/USD buyers seem set for a potential breakout towards the confluence of the 50-day and 200-day Simple Moving Averages (SMAs) around $2,535.
Late in June, the ETH price recovered from a horizontal support zone that’s held since early February, before retreating from the $2,535 region where the 50-day SMA meets the 200-day SMA. A decisive move above this level would confirm a ‘Golden Cross’—a bullish signal where the 50-day SMA crosses above the 200-day SMA, often suggesting further upside. While the 50-day SMA is already above the 200-day SMA, the ‘Golden Cross’ is still in the early stages as of Tuesday and needs to hold to attract ETH buyers.
However, strong resistance lies ahead. A four-month-old ascending trendline near $2,885 and a longer-standing resistance area between $2,880 and $2,925 are likely to challenge bulls before any move higher.
If these levels are cleared, ETH/USD could aim for the $3,000 mark, followed by late January swing highs at $3,440 and $3,525.
Alternatively, a pullback remains unlikely unless ETH/USD falls below the five-month horizontal support zone between $2,100 and $2,152. If that level breaks, the $2,000 psychological level and mid-April highs near $1,700 could come into play for bearish targets.
ETH/USD: Four-Hour chart signals inaction

Source: TradingView
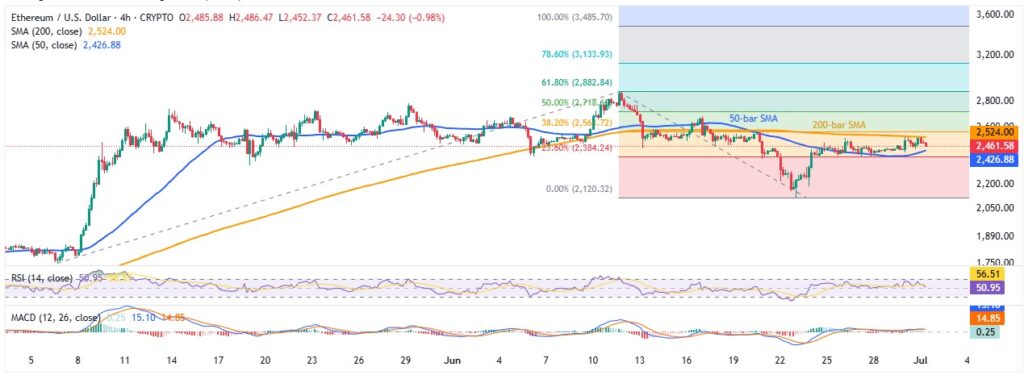
While the daily chart hints at bullish momentum, the four-hour timeframe shows ETH/USD consolidating between the 50-bar and 200-bar Simple Moving Averages (SMAs), with the price recently pulling back from the 200-bar SMA resistance of $2,524.
Despite this dip, the pullback remains limited as the RSI stays above 50 and the MACD continues to flash bullish signals. This suggests a likely rebound from the 50-bar SMA support around $2,426.
If ETH/USD fails to hold $2,426, the $2,400 psychological mark will act as immediate support before exposing the monthly low near $2,115 and further downside zones outlined on the daily chart.
On the upside, a sustained break above the 200-bar SMA at $2,524 would still need confirmation above $2,540—a key level from the daily chart—to activate bullish momentum toward higher resistance levels. Traders should also watch the 61.8%, 78.6%, and 100% Fibonacci Extension (FE) levels of the May–June swing: $2,883, $3,134, and $3,486, respectively.
Overall, Ethereum’s current consolidation does little to disrupt the broader bullish bias, especially with a “Golden Cross” on the daily timeframe.


