- Ethereum price stays pressured at week’s low, reversing previous weekly gains.
- Early-week pullback from multi-month resistance, 50-day SMA breakdown, and bearish MACD signal short-term weakness for ETH.
- A convergence of the 100-day SMA, the bearish triangle’s support lures Ethereum sellers.
- ETH’s broad bullish trend holds beyond $3,100, while recovery remains elusive below $4,830.
Ethereum (ETH) slides 0.5% to $4,350 early Friday as bears keep reins at the lowest level in a week, while bracing for a weekly loss following the previous day’s downside break of the 50-day Simple Moving Average (SMA).
Apart from the 50-day SMA breakdown, an impending bearish crossover on the Moving Average Convergence Divergence (MACD) momentum indicator, as well as downbeat conditions of the 14-day Relative Strength Index (RSI), also reinforce the ETH’s short-term downside bias.
Meanwhile, a pullback in the trading volume and a downbeat market capitalization (market cap) add strength to the bearish bias. According to Santiment, Ethereum’s daily trading volume drops from Thursday’s $47.9 billion to $44.08 billion, while the market cap hits the lowest level in October by falling to $523.56 billion.
Still, a convergence of key technical levels and upbeat fundamentals surrounding the second-largest cryptocurrency defends the overall bullish trend, as long as the price stays beyond $3,100.
Also Read: Ethereum Price Eyes $5000 as Fusaka Upgrade Inches Closer
Ethereum Price Daily Chart Points To Growing Bearish Bias

Ethereum’s reversal from a two-month horizontal resistance, followed by the downside break of a 50-day SMA, underpins short-term bearish bias surrounding the altcoin. Adding strength to the downside outlook is the impending bearish crossover on the MACD, as the green histograms are almost absent, and the RSI line is making rounds to the 50.00 neutral mark, suggesting a continuation of the latest weakness in the prices.
With this, the ETH looks poised for further downside, targeting the late August swing low surrounding $4,065. However, an ascending trend line from August 02, forming part of a bearish triangle, and the 100-day EMA, close to $4,020-$4,010, quickly followed by the $4,000 threshold, appears to be a tough nut to crack for Ethereum bears. Below that, a six-month ascending trendline support near $3,380 and August’s low around $3,357, as well as the 200-day SMA level of $3,100, will be the last line of defense for the bulls. On the flip side, ETH’s recovery needs validation from the 50-day SMA hurdle of $4,410 and 23.6% Fibonacci Extension (FE) of its June-September moves, close to $4,510.
More importantly, the $4,765-$4,830 area, forming part of a multi-week triangle, seems to be a strong resistance for Ethereum buyers to cross before they aim for the all-time high of $4,955 and the $5,000 round figure.
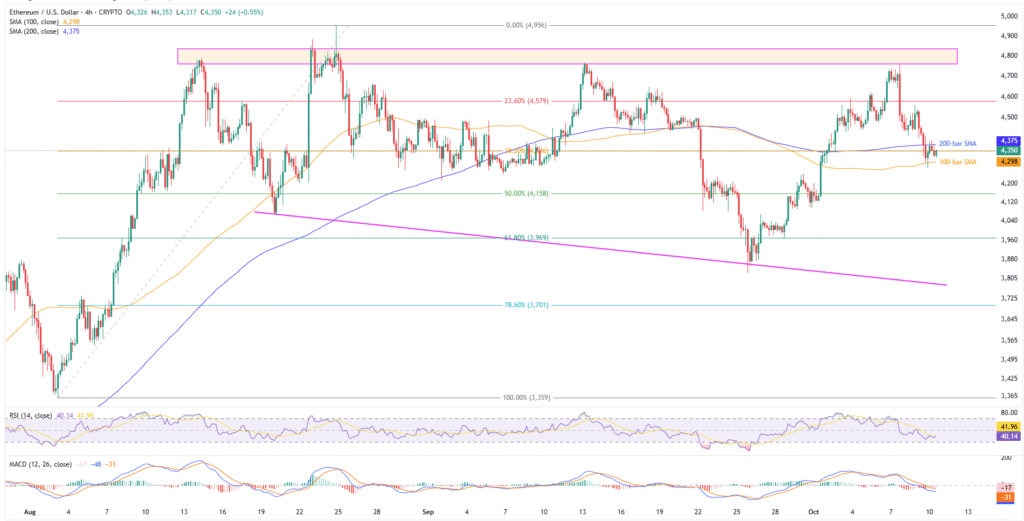
Ethereum’s Four-Hour Chart Portrays Consolidation

Ethereum’s four-hour chart highlights the quote’s trading between the 100-bar and 200-bar SMAs, respectively, around $4,298 and $4,375. That said, the ETH’s early-month reversal from the broad resistance area joins stronger bearish signals (red histograms) than the daily chart, as well as the downbeat but not oversold RSI, to keep sellers hopeful.
This highlights 50% and 61.8% Fibonacci retracements of Ethereum’s August upside, around $4,158 and $3,970 in that order, if the quote slides beneath the 100-bar SMA. Following that, a seven-week-old descending support line near $3,788 and the daily chart’s deeper levels will be in the spotlight.
On the flip side, ETH recovery should initially aim for the 200-bar SMA of $4,375 before the 23.6% Fibonacci ratio surrounding $4,580, and the broad resistance area around $4,765-$4,830 could challenge the bulls.
Bottom Line
Ethereum’s U-turn from a key resistance area, downside break of 50-day SMA, and bearish momentum indicators keep short-term sellers optimistic even as the strong downside supports and upbeat fundamentals defend the broad bullish trend.
Also read: ETH Price Falls 5%, Exchange Reserves Drop; Is a buy Opportunity?


