- Ethereum price stays lackluster after rebounding from multi-month support, reversing Friday’s decline.
- ETH bulls stay hopeful as price holds above the 100-day SMA and 10-week ascending trendline, despite weak MACD and RSI signals.
- A two-month-old support zone is crucial for Ethereum’s push toward a new all-time high.
- ETH bears remain off the table beyond the ascending support line from April, 200-day SMA.
- Short-term recovery aligns with the broad bullish trend, but a rally to refresh the ATH needs a fundamental push.
Ethereum (ETH) seesaws around $4,160-$4,155 on Monday, trying to reverse Friday’s heavy slump while keeping the weekend recovery from a multi-month support line.
The altcoin’s earlier rebound broke above the 100-day Simple Moving Average (SMA) and a two-month ascending trendline, reigniting bullish momentum after a steep drop.
However, a steady 14-day Relative Strength Index (RSI) line and bearish signals from the Moving Average Convergence Divergence (MACD) momentum indicator test the ETH bulls.
On the same line, easing trading volume and a sluggish market capitalization (market cap) also raise doubts on Ethereum’s recovery. That said, the ETH’s daily trading volume eases for the third consecutive day after hitting an all-time high (ATH) of $97.73 billion on Friday, currently around $60.95 billion, whereas the market cap defends recovery from a 10-week low around $504.95 billion, according to Santiment.
With this, Ethereum looks set to regain its broader bullish momentum, though it needs strong fundamental support to sustain the move.
Ethereum Price: Daily Chart Lures Buyers

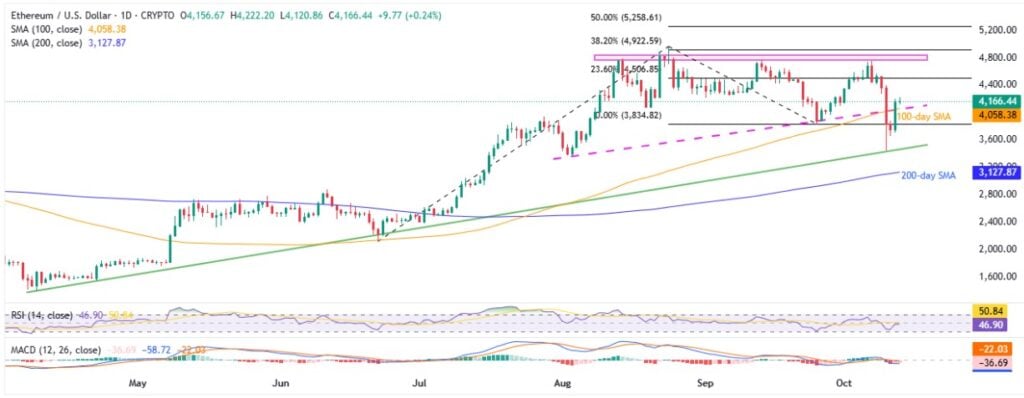
Ethereum’s clear upside break of the $4,060 key resistance, now support, comprising the 100-day SMA and an ascending trend line from early August, joins the prior recovery from a six-month rising support line to lure buyers.
Still, the RSI is below the 50.00 neutral level and the MACD flashes bearish signals (red histograms), which in turn portrays the traders’ inability to defend the previous rebound, citing the need for a strong fundamental catalyst to fuel the prices.
With this, the quote’s rise past the 23.6% Fibonacci Extension (FE) of its June-September moves, near $4,507, becomes necessary to attract the bulls. However, a horizontal area comprising multiple levels from mid-August, near $4,830-$4,768, will be crucial before buyers can aim for the fresh ATH, currently around $4,955.
In that case, the $5,000 threshold and the 50% FE level near $5,260 will be in the spotlight.
On the flip side, the ETH pullback remains elusive beyond the $4,060 resistance-turned-support.
Below that, an ascending trend line from April, close to $3,480, and the 200-day SMA level of $3,127 will be on the seller’s radar.
Notably, the $4,000 threshold, the $3,500 mark, and Friday’s low of $3,447 may also act as intermediate halts between $4,060 and $3,127.
Ethereum Price: Four-Hour Chart Looks More Bullish

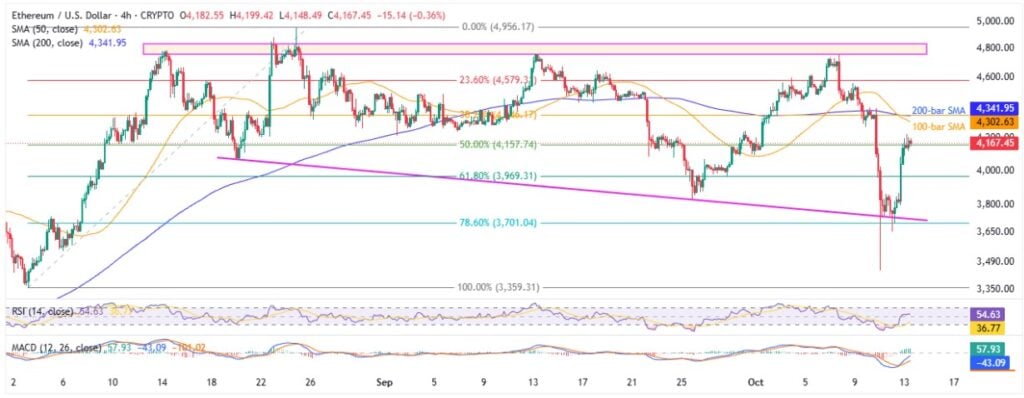
On the four-hour chart, Ethereum’s rebound from a seven-week support line gains support from an upbeat RSI line, above 50.00, and bullish MACD signals (green histograms) to lure buyers.
However, the 100-bar and the 200-bar SMAs, respectively near $4,305 and $4,342, guard short-term ETH run-up before the daily chart’s higher levels.
Alternatively, the 61.8% Fibonacci retracement of Ethereum’s August upside, near $3,970, can attract short-term sellers during the quote’s fresh fall.
Below that, an ascending trend line from August 20 and the 50% Fibonacci ratio, respectively near $3,720 and $3,700, will be the last line of defense for the ETH bulls before highlighting deeper levels discussed on the daily chart.
Conclusion
Ethereum keeps the previous recovery from multi-month support, extending key resistance breakout, but sluggish momentum indicators like the RSI and the MACD signal that strong fundamentals are needed to sustain the bullish outlook.
Also read: Cryptocurrency Weekly Price Prediction: BTC, ETH & XRP Plummet under U.S. Risk Pressure


