- Ethereum price hits weekly low during four-day losing streak, nears key support as crypto faces broad risk-off pressure.
- Reversal from 50-day EMA, downside break of 12-week support, and bearish MACD signals favor ETH sellers.
- Ethereum’s further downside hinges on crucial support where the 200-day EMA meets the six-month bullish trendline.
- Bears may aim for $2,900 if $3,550 fails, threatening Ethereum’s broader bullish trend.
Ethereum (ETH) extends its four-day losing streak to hit a fresh weekly low around $3,730 early Friday, stretching the downside break of a 12-week horizontal support as broad risk-aversion weighs on the crypto market. In doing so, the ETH ignores upbeat ecosystem news, raising doubts about the previous bullish forecasts.
Also read: Ethereum News Today: BitMine Snaps Up $417M of ETH Amid Tom Lee’s $10K Prediction
Notably, bearish signals from the Moving Average Convergence Divergence (MACD) and the 14-day Relative Strength Index (RSI) momentum indicators add strength to the downside bias.
On the same line, strong trading volume and a downbeat market capitalization (market cap) also reinforce the seller’s conviction. According to Santiment, Ethereum’s daily trading volume hits a three-day high of $58.78 billion, whereas the market cap slides to a one-week low of $450.62 billion.
Still, a downside break of the six-month ascending trendline and 200-day Exponential Moving Average (EMA) becomes necessary to threaten the broad bullish trend.
Ethereum Price: Daily Chart Lures Sellers

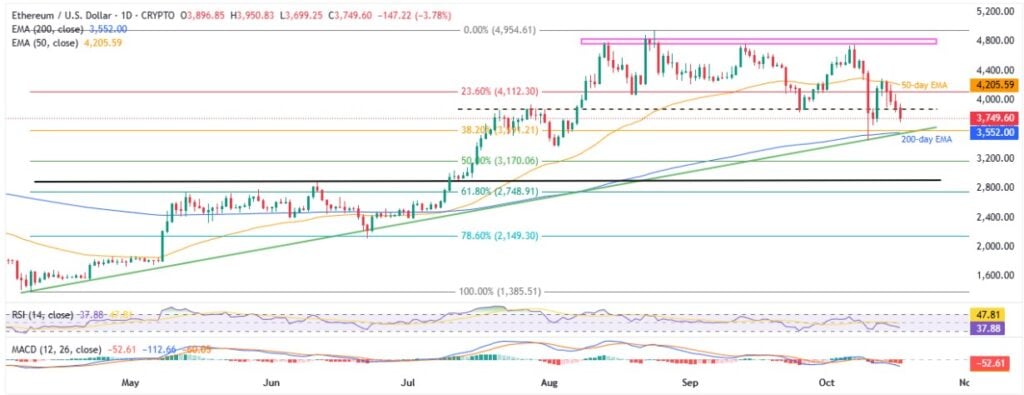
Ethereum’s clear U-turn from the 50-day EMA, a daily closing beneath the horizontal area from late July, and bearish MACD signals together bolster the quote’s current downside bias.
With this, the ETH bears look well-set to approach the $3,550 support confluence comprising the 200-day EMA and a six-month ascending trendline.
However, nearly oversold RSI might challenge the sellers to break the key support; if not, then 50% Fibonacci retracement of Ethereum’s April-August upside and a four-month horizontal support, respectively near $3,170 and $2,900, will be in the spotlight.
It’s worth mentioning that the ETH’s weakness past $2,900 will put the broad bullish trend at risk, while directing prices further south toward the 78.6% Fibonacci ratio and the yearly low, close to $2,150 and $1,385 in that order.
On the flip side, multiple levels since July 21 form strong immediate resistance around $3,880-85, quickly followed by the $4,000 threshold.
Beyond that, the 23.6% Fibonacci retracement level of $4,112 and the 50-day EMA of $4,205 will act as the bear’s last defense before giving control to the ETH bulls.
In that case, a horizontal area comprising multiple levels from mid-August, near $4,830-$4,768, will be crucial before buyers can aim for the fresh ATH, currently around $4,955. This highlights the $5,000 threshold for the ETH bulls.
Ethereum Price: Four-Hour Chart Signals Consolidation

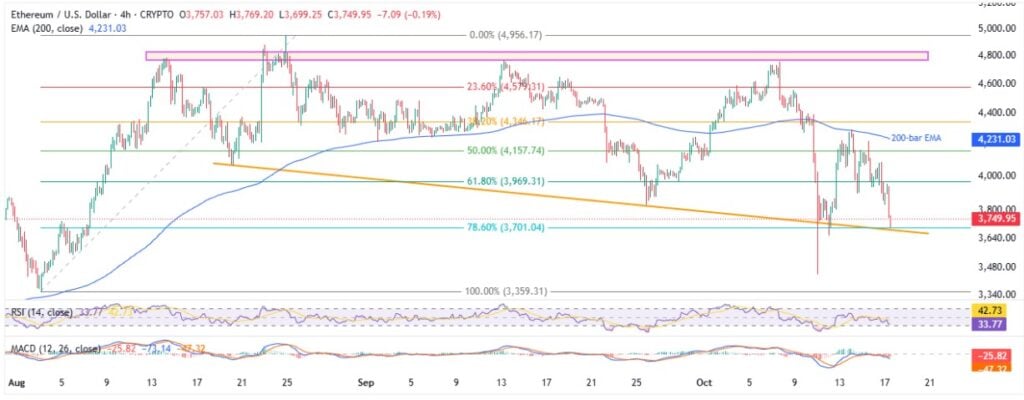
Unlike the daily chart, Ethereum’s four-hour price action shows its proximity to the short-term key supports, namely the 78.6% Fibonacci retracement of its August up-move and an eight-week-old descending trendline, respectively near $3,700 and $3,680.
Adding strength to the immediate supports is the oversold RSI line and sluggish MACD signals.
With this, the ETH may witness short-term consolidation in prices, highlighting the 61.8% and 50% Fibonacci ratios of $3,970 and $4,157, as well as the 200-bar EMA hurdle of $4,231.
In a case where Ethereum buyers keep the reins past $4,231, the multi-week horizontal resistance area near $4,768-$4,830 and the daily chart’s higher levels will be on their radars.
Alternatively, a downside break of $3,680 could drag the ETH toward Saturday’s low of $3,447 and August’s low of $3,356, before the deeper levels discussed on the daily chart.
Conclusion
Ethereum sellers cheer a clear U-turn from the 50-day EMA and a multi-month horizontal support breakdown amid bearish MACD signals. However, the nearly oversold RSI and proximity to the short-term support suggest a consolidation in the prices before the next downturn. Meanwhile, $3,550 and $2,900 become crucial for bears to watch as a downside break of the same could challenge the altcoin’s broad bullish trend.


