- Ethereum price edges higher after snapping a two-day rebound, testing pullback from key resistance but lacking momentum.
- 21-day and 50-day EMA joins the middle Bollinger Band to highlight $4,240-$4,260 as strong resistance.
- Bearish MACD, DMI signals validate ETH’s previous retreat from a decisive upside hurdle.
- ETH bears remain cautious beyond the 200-day EMA and the ascending support line from April.
- Potential short-term pullback contradicts the broad bullish trend, but a slump to refresh the monthly low needs a fundamental push.
Ethereum (ETH) price reclaims $4,200, up 1.0% on a day, early Wednesday as traders consolidate the previous day’s retreat from the key resistance.
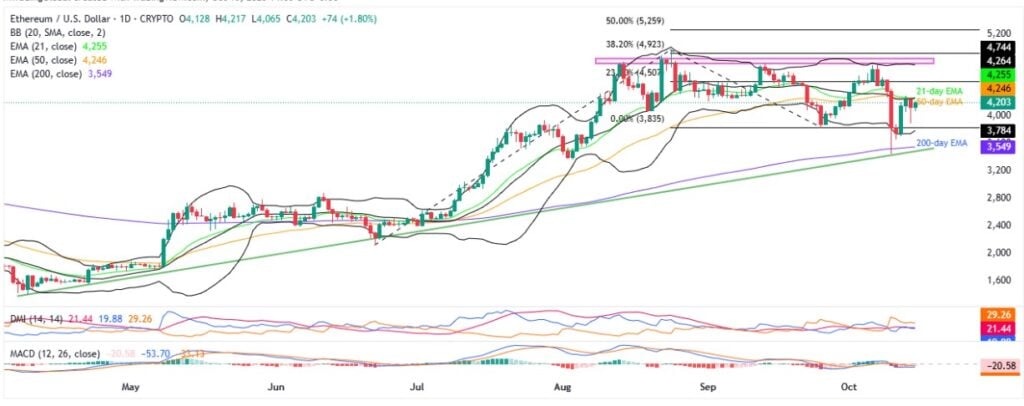
On Tuesday, ETH reversed from the $4,240-$4,260 resistance confluences, after a two-day winning streak. The altcoin’s pullback also gained support from bearish signals from the Moving Average Convergence Divergence (MACD) and the Directional Movement Index (DMI) momentum indicators to lure sellers.
Still, Ethereum’s sustained trading beyond multi-month support levels and a pullback in the trading volume, as well as the market capitalization (market cap), challenge the odds of witnessing a sharp fall in prices, like we saw on Friday. According to Santiment, the ETH’s daily trading volume retreats from a four-day high to $63.04 billion, whereas the market cap keeps Monday’s pullback from a week’s high to $486.38 billion by press time.
With this, the altcoin traders look confused while accepting the bearish technical signals that challenge the broad bullish trend.
Also read: BitMine and Strategy Defy Sell-Off with 202K Ether and 220 Bitcoin Purchases
Ethereum Price: Daily Chart Tests Sellers

Ethereum’s clear U-turn from a confluence of the 21-day and 50-day Exponential Moving Averages (EMAs) and the middle Bollinger Band (BB), reinforced by bearish MACD histograms (red) and a downbeat DMI with the Downmove (D-, Orange) line on top, signals rising short-term selling interest.
With this, the intraday sellers of the ETH could aim for the $4,000 threshold before the lower BB support of around $3,775.
While the quote’s rebound from the lower BB is widely anticipated, a failure to do so can allow bears to challenge the crucial downside support levels, namely the 200-day EMA and an ascending support line from April, respectively near $3,548 and $3, 475.
In a case where the ETH remains bearish past $3,475, it becomes vulnerable to slump toward June’s high surrounding $2,880, with the $3,000 threshold likely acting as an intermediate halt.
Alternatively, the ETH rebound remains elusive beneath the $4,240-$4,260 resistance confluences comprising the key EMAs and the middle BB.
Beyond that, the 23.6% Fibonacci Extension (FE) of its June-September moves, near $4,507, could attract the bulls. However, a horizontal area comprising multiple levels from mid-August, near $4,830-$4,768, will be crucial before buyers can aim for the fresh ATH, currently around $4,955.
In that case, the $5,000 threshold and the 50% FE level near $5,260 will be in the spotlight.
Ethereum Price: Four-Hour Chart Looks Less Bearish

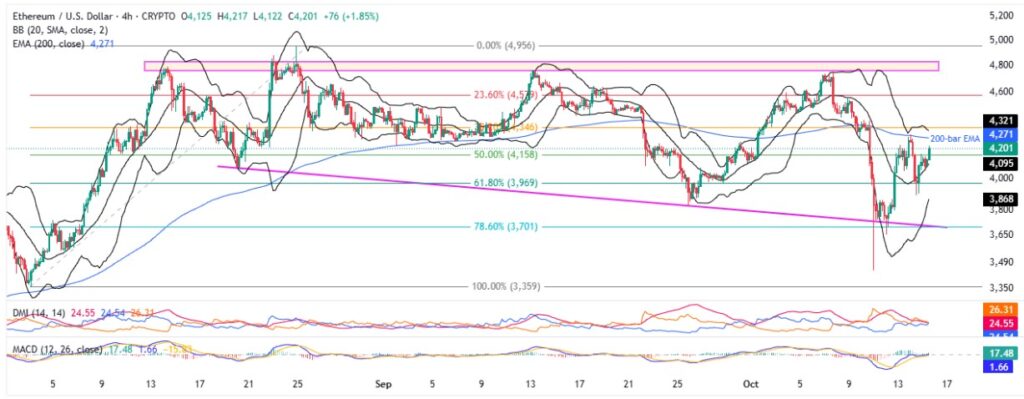
On the four-hour chart, Ethereum recovers from the middle BB and gains support from the bullish MACD signals, even as the DMI keeps flashing bearish signs like the daily chart.
However, the ETH recovery remains elusive below the 200-bar EMA hurdle of $4,270. Also challenging the Ethereum bulls could be the upper BB of $4,315.
After that, a 23.6% Fibonacci retracement of Ethereum’s August upside, near $4,580, will act as the final line of defense for bears before highlighting the daily chart’s higher levels.
Meanwhile, the ETH pullback can target the 61.8% Fibonacci ratio, also known as the “Golden Fibonacci Ratio”, surrounding $3,969, before the lower Bollinger Band of $3,869, an eight-week falling support line near $3,700, and deeper levels discussed on the daily chart.
Conclusion
Ethereum’s latest price action lacks conviction, as short-term bearish signs contradict the broad bullish trend. This highlights the need for strong fundamental catalysts for clear direction.
Also read: Cryptocurrency Weekly Price Prediction: BTC, ETH & XRP Plummet under U.S. Risk Pressure


