- Ethereum price seesaws at a three-week-high, stalling a two-day rise after defying a multi-week bearish channel.
- Sustained trading beyond key SMAs, bullish MACD, and DMI signals add strength to the ETH’s upside bias.
- Two-month horizontal resistance tests Ethereum buyers as they head toward refreshing a record high.
- ETH pullback may stall around $4,555, with multiple SMAs offering additional downside filters.
- Ethereum looks poised to renew its all-time high as long as it traders beyond the 200-day SMA.
Ethereum (ETH) hovers around $4,680 early Tuesday as bulls take a breather at the highest level in three weeks, following a two-day winning streak.
Despite the latest pause, the second-largest cryptocurrency’s breakout of a multi-week bearish channel formation, backed by bullish signals from the Directional Movement Index (DMI) and Moving Average Convergence Divergence (MACD) momentum indicators, keep ETH buyers optimistic.
Also favoring Ethereum bulls is a four-day-high trading volume, despite a pullback in the market capitalization (market cap). According to Santiment, Ethereum’s daily trading volume hits a four-day high of $45.32 billion, whereas the market cap retreats from a three-week high to $564.81 billion by press time.
Notably, chatter surrounding $72 million ETH accumulation by whales and Grayscale’s first-ever Ethereum and Solana staking ETPs (Exchange Traded Products) in the U.S. adds strength to the altcoin’s upside bias.
Also read: Grayscale Debuts First-Ever Ethereum, Solana Staking ETPs in US
However, several levels since August 13 and the market’s cautious mood test the ETH bulls before directing them to a fresh all-time high (ATH).
Ethereum Price: Daily Chart Defends Bullish Bias

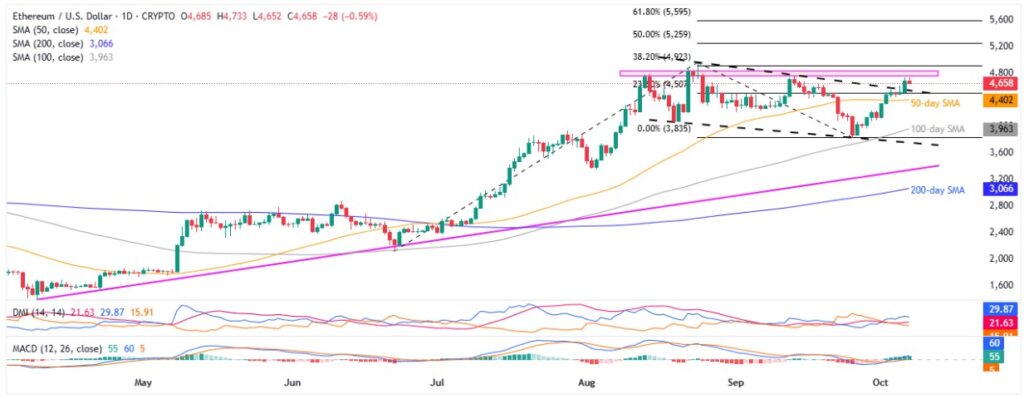
Monday’s clear breakout of a seven-week bearish trend channel joins bullish MACD signals (green histograms) and upbeat DMI clues to keep Ethereum buyers optimistic despite the quote’s latest inaction.
That said, the DMI’s Upmove (D+, Blue) line tops Downmove (D-, Orange) and the ADX (Average Directional Index, red) lines, portraying the bull’s dominance. That said, the D+ line is above the 25.00 neutral level and is backed by the ADX, while the D- line stays at the bottom, pointing to a strong upside bias.
With this, the ETH is likely to overcome the eight-week horizontal resistance area surrounding $4,768-$4,830. Apart from the multi-week resistance zone, the recent ATH of around $4,955 and the $5,000 threshold could also test the buyers.
Beyond that, the 50% and 61.8% Fibonacci Extensions (FE) of the ETH’s June-September moves, respectively near $5,260 and $5,600, will be in the spotlight as bulls eye a fresh record top.
On the flip side, Ethereum’s pullback might aim for the aforementioned bearish channel’s top, close to $4,555.
However, the 50-day and 100-day SMAs, close to $4,400 and $3,960 in that order, followed by the channel’s bottom of around $3,765, could test the bears before giving them control.
Above all, an ascending support line from April, close to $3,350, and the 200-day SMA level of $3,065 act as the final line of defence for the Ethereum buyers.
Ethereum Price: Four-Hour Chart Highlights $3,970

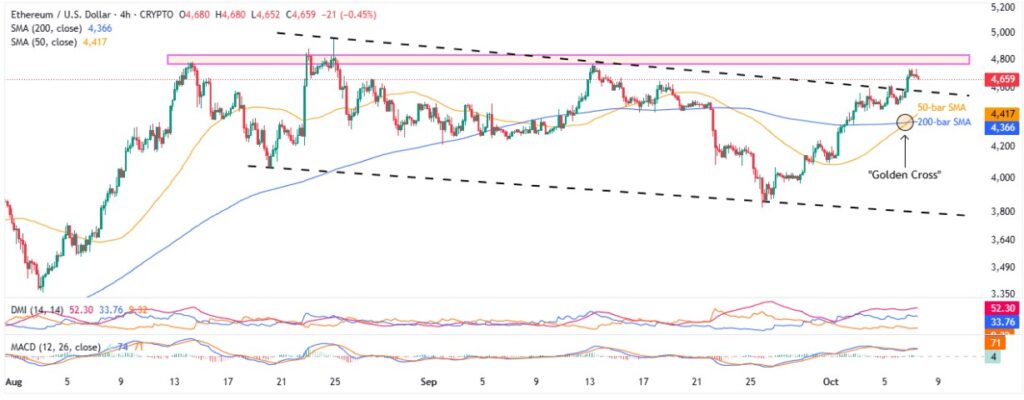
On the four-hour chart, sluggish MACD signals and comparatively less bullish clues from the DMI test ETH buyers beneath the key resistance area surrounding $4,768-$4,830.
Notably, Ethereum posts a classic bullish moving average crossover signal called “Golden Cross” on the four-hour chart to strength the upside bias. That said, the 50-bar Simple Moving Average (SMA) pierces the 200-bar SMA from below to portray the “Golden Cross” bullish SMA pattern and suggest further rise in prices.
This also highlights the 50-bar and 200-bar SMA supports, respectively near $4,417 and $4,366, as additional downside filters.
Conclusion
Ethereum holds the week-start breakout of the key bearish trend channel, despite recent price consolidation. Adding strength to the upside bias are bullish momentum indicators and a “golden cross” on the four-hour chart, pointing toward a fresh all-time high for ETH.


