- Ethereum price hits its lowest level since early August, down for five consecutive days as bears target key supports.
- The lower Bollinger Band and the two-month previous resistance limit ETH’s immediate downside.
- Break below the 50-day EMA joins bearish MACD and DMI signals to attract Ethereum sellers.
- A clear break of $3,970 can direct ETH bears toward the August low.
- Ethereum may dip in the short term, but the overall bullish trend holds as long as it stays above $3,225.
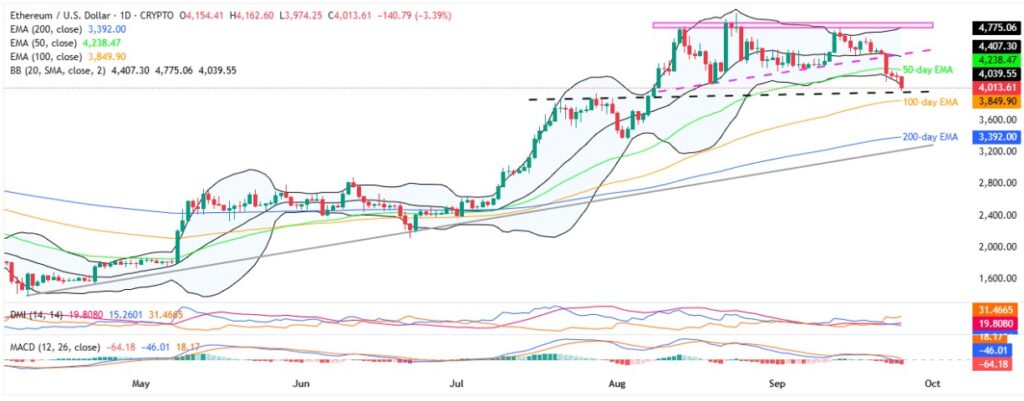
Ethereum (ETH) slides over 3.0% to $3,974 early Thursday, the lowest since August 08, before bouncing off to $4,013 by press time. In doing so, the ETH bears poke critical technical supports during its five-day losing streak.
Ethereum’s early-week break below the 50-day Exponential Moving Average (EMA), its first in three months, initially flashed the bearish sign. Adding strength to the downside bias are bearish signals from the Directional Movement Index (DMI) and Moving Average Convergence Divergence (MACD) momentum indicators.
Also keeping Ethereum sellers hopeful is a three-day high trading volume and a commensurate fall in the market capitalization (market cap). According to Santiment, Ethereum’s daily trading volume hits a three-day high of $40.82 billion, whereas the market cap drops to the lowest level since August 08, close to $482.45 billion by press time.
Still, the lower Bollinger Band (BB) and a nine-week-old resistance-turned-support line challenge the ETH bears as they aim for the previous monthly low.
Ethereum Price: Daily Chart Suggests Short-term Downside

A clear breakdown from a six-week ascending triangle and the 50-day EMA joins bearish MACD signals (red), and downbeat momentum clues from the DMI indicator to attract short-term Ethereum sellers.
That said, the DMI’s Downmove (D-, Orange) line jumps past the 25.00 neutral level to 31.00 as we write, suggesting an increase in the downside momentum. Meanwhile, the ADX (Average Directional Index, red) and the D+ (Upmove, blue) line are both way below the 25.00 neutral level, pointing to very weak upside bias.
With this, the ETH looks poised to visit the previous resistance line from July, now support around the $3,970 threshold. However, the lower Bollinger Band (BB) may test intraday sellers around $4,040.
In a case where the bears dominate past $3,970, it becomes vulnerable to revisit the previous monthly low of around $3,355. Additionally, the 100-day and 200-day EMAs, respectively near $3,850 and $3,390, will precede an ascending support line from April, close to $3,225, to act as the final line of defence for the Ethereum buyers.
Alternatively, the altcoin’s fresh recovery remains elusive beneath the 50-day EMA level surrounding $4,240 and the stated triangle’s bottom surrounding $4,445.
Beyond that, the upper BB, close to $4,775, could challenge the ETH bulls before directing them to the horizontal resistance zone from August 13, around $4,765-$4,830, and then to the recent ATH of around $4,955. It’s worth noting that Ethereum’s successful trading past $4,955 won’t hesitate to aim for the $5,000 psychological magnet.
Ethereum Price: Four-Hour Chart Highlights $3,970

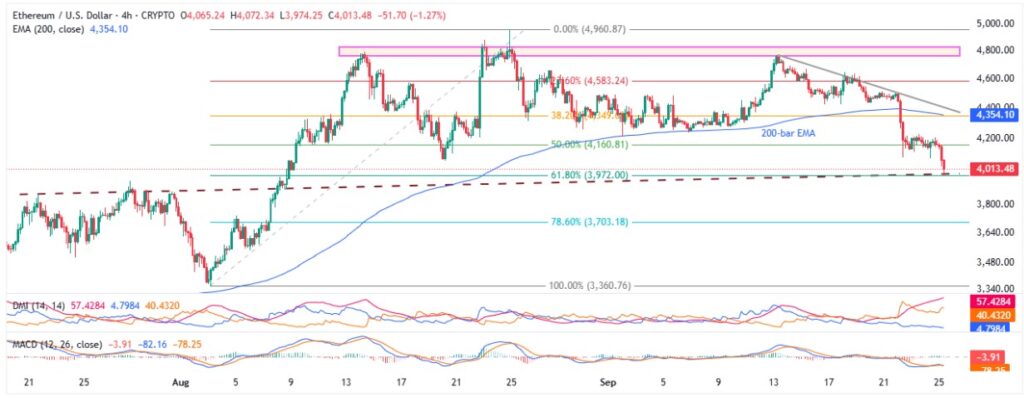
On the four-hour chart, the ETH’s latest 200-bar EMA breakdown gains additional bearish support from the downbeat MACD and DMI signals, highlighting $3,970 as the short-term key level.
Notably, the DMI’s Downmove (D-, Orange) line marks a stellar jump to around 57.0, way beyond the 25.00 neutral line, increasing the importance of the $3,970 support.
Below that, the previous monthly low of near $3,350 and deeper levels discussed on the daily chart will be in the spotlight. During the fall, the 78.6% Fibonacci retracement of the ETH’s August upside, near $3,703, can act as an intermediate halt.
On the flip side, the ETH recovery needs to offer a clear breakout of the $4,355 resistance, comprising the 200-bar EMA.
Even so, a descending resistance line from September 13, near $4,420, could act as an additional upside filter ahead of highlighting the stated triangle’s upper region surrounding $4,765-$4,830 and higher levels from the daily chart.
Conclusion
Ethereum’s bearish price action gains support from the key support breakdown, bearish momentum signals, and a strong U.S. Dollar, to attract short-term sellers. However, the broader bullish trend holds intact as long as it stays beyond an ascending support line from April, close to $3,225.
Also read: Crypto Morning News: Bitcoin Fights for 114K as Powell’s Warning and Trump’s Speech Shake Sentiment


