- Ethereum price drops 6.0%, hitting a fresh monthly low on technical breakdown.
- Six-week bearish triangle breakdown lures ETH sellers amid downbeat momentum indicators.
- The previous resistance line from July appears to be short-term key support for Ethereum bears to watch.
- Key EMAs and multi-month support line keep ETH bulls in play, despite short-term bearish pressure.
Ethereum (ETH) price falls around 6.0% intraday to $4,082, hitting a month’s low, before bouncing back to $4,200 early Monday.
The second-largest cryptocurrency’s stellar fall could be linked to a bearish triangle formation, sustained U.S. Dollar strength, and downbeat momentum indicators, such as the Directional Movement Index (DMI) and Moving Average Convergence Divergence (MACD).
Additionally, strong trading volume and downbeat market capitalization (market cap) also reinforce bearish bias about the ETH coin. According to Santiment, Ethereum’s daily trading volume reached a five-day high of $40.97 billion, while the market cap dropped to its lowest level since August 19, at $506.61 billion by press time.
Despite the latest drop, Ethereum remains well above the key Exponential Moving Averages (EMAs) and multi-month support levels, which in turn keeps the broader bullish trend intact.
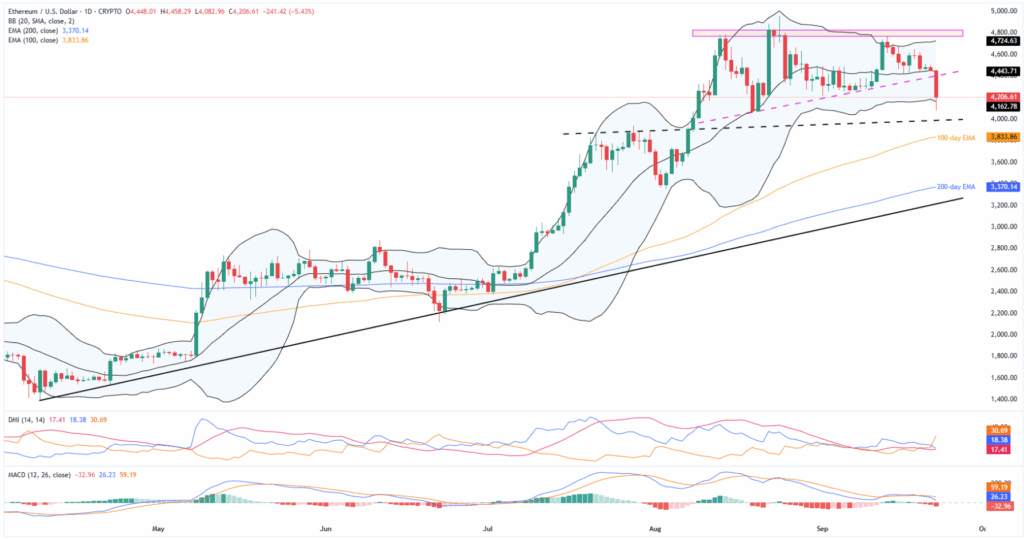
Ethereum Price: Daily Chart Suggests Short-term Downside

A clear breakdown from a six-week ascending triangle, bearish MACD signals (red), and downbeat momentum clues from the DMI indicator attract short-term Ethereum sellers.
That said, the DMI’s Downmove (D-, Orange) line jumps past the 25.00 neutral level, suggesting an increase in the downside momentum. Meanwhile, the ADX (Average Directional Index, red) and the D+ (Upmove, blue) line are both way below the 25.00 neutral level, pointing to very weak upside bias.
With this, the ETH looks poised to visit the previous resistance line from July, now support around the $4,000 threshold. However, the lower Bollinger Band (BB) may test intraday sellers around $4,160.
In a case where the bears dominate past $4,000, the 100-day and 200-day EMAs, respectively near $3,830 and $3,370, will precede an ascending support line from April, close to $3,215, to act as the final line of defence for the Ethereum buyers.
Alternatively, the altcoin’s fresh recovery remains elusive beneath the stated triangle’s bottom surrounding $4,395.
Beyond that, the middle and upper BBs, close to $4,445 and $4,725, could challenge the ETH bulls.
The horizontal resistance zone, since August 13, around $4,765-$4,830, presents a significant hurdle for ETH bulls aiming for a new all-time high (ATH) near $5,000. That said, the recent ATH of about $4,955 could act as an intermediate resistance on the way up.
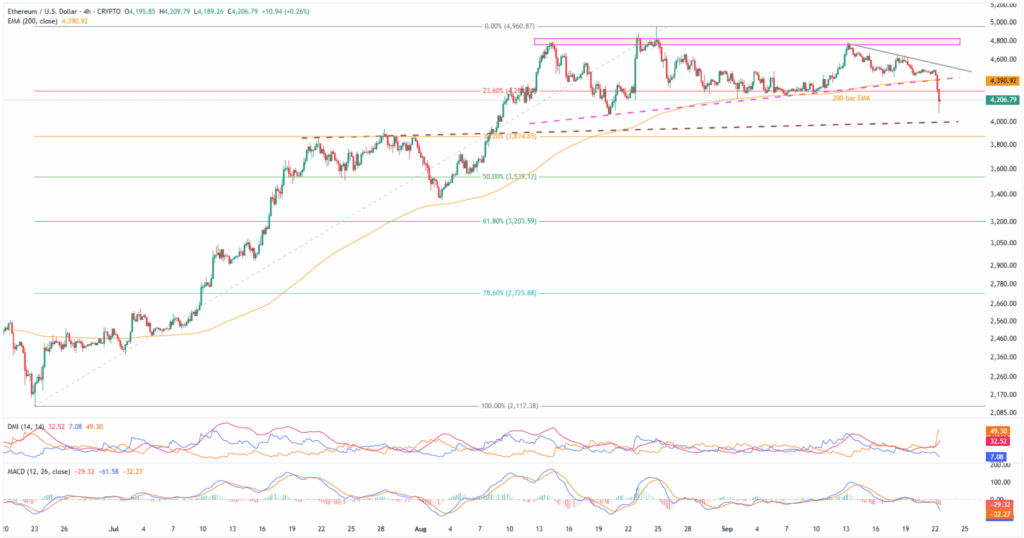
Ethereum Price: Four-Hour Chart Highlights $4K

On the four-hour chart, the ETH’s latest triangle breakdown gains additional bearish support as the stated triangle’s bottom joined the 200-bar EMA support to highlight $4,395 as the short-term key level.
However, the DMI’s Downmove (D-, Orange) line marks a stellar jump to around 50.0, way beyond the 25.00 neutral line, highlighting the $4,000 support line, previous resistance from July, as crucial for sellers.
Below that, the previous monthly low of near $3,350 and deeper levels discussed on the daily chart will be in the spotlight.
On the flip side, the ETH recovery needs to offer a clear breakout of the $4,395 resistance confluence to recall the buyers.
Even so, a week-long descending resistance line near $4,555 could act as an additional upside filter ahead of highlighting the stated triangle’s upper region surrounding $4,765-$4,830 and higher levels from the daily chart.
Conclusion
Ethereum’s bearish price action gains support from the triangle breakdown, bearish momentum and strong U.S. Dollar, drawing short-term sellers targeting the $4,000 threshold. However, the broader bullish trend holds intact as long as it stays beyond an ascending support line from April, close to $3,125.
Also read: Cryptocurrency Weekly Price Prediction: BTC Holds, But ETH & XRP Dip as Dollar Edges Up


