- Hyperliquid defends Friday’s rebound from key support as two-week consolidation continues.
- HYPE gain support from HSI’s buyback, growing dominance in derivatives market and HyperEVM upgrade.
- Bullish flag on four-hour, upbeat oscillators keep buyers focus on $45.70 for breakout.
- Downside break of $40.00 can trigger HYPE/USD’s short-term correction.
Hyperliquid (HYPE/USD) edges higher around $44.00 during Tuesday’s European session, keeping the last week’s rebound from the key technical supports, amid upbeat 14-day Relative Strength Index (RSI) and mixed signals from the Moving Average Convergence Divergence (MACD) indicator.
Despite the quote’s latest inaction, the HYPE/USD pair is up for the fourth consecutive month as July is nearing its end, following a run-up to refresh its all-time high (ATH) during the mid-monthly rally.
On the fundamental side, the HYPE coin benefits from Hyperliquid Strategies Inc.’s (HSI) coin buyback, a strategic move to build $880 million worth of corporate treasury with HYPE as the primary asset. Further, the Hyperliquid trading platform’s rising dominance in the perpetual derivatives market, capturing nearly 60% market share, and around 22% in the total derivatives market, also adds strength to the HYPE/USD run-up. On the same line, the recent HyperEVM upgrade and institutional partnership with Paradigm/Nasdaq support the bullish bias surrounding the Hyperliquid coin (HYPE).
Hyperliquid: Daily Chart Signals Ample Upside Room

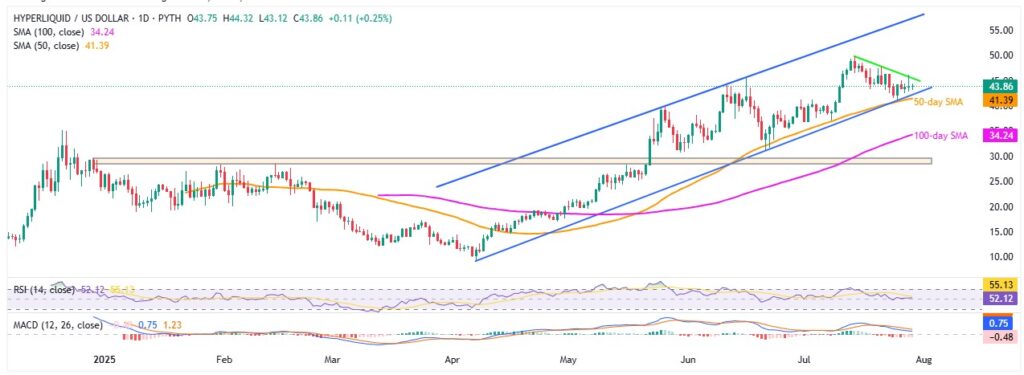
Even if HYPE consolidates monthly gains after hitting the record top, it does defend Friday’s successful rebound from the 50-day Simple Moving Average (SMA) and lower boundary of a bullish channel established since early April. This joins upbeat RSI conditions and slightly bearish bias of the MACD to lure HYPE bulls, especially amid optimistic fundamentals.
However, a fortnight-old descending resistance line currently challenges the buyers around $45.70. Following that, the all-time high marked earlier in the month, around $49.85, close to the $50.00 threshold, will be in the spotlight.
Should the HYPE/USD bulls keep the reins past $50.00, a gradual run-up towards the aforementioned bullish channel’s top, surrounding $57.00 and the $60.00 round figure can’t be ruled out.
Alternatively, the stated channel’s support, near $42.30, and 50-day SMA level of $41.30 could restrict the short-term downside of the HYPE/USD pair ahead of the $40.00 round figure.
Following that, the 100-day SMA and a seven-month-old horizontal support region could challenge Hyperliquid bears around $34.25 and $29.50-$28.30 region before giving control to them.
Hyperliquid: Four-Hour Chart Highlights Bull Flag

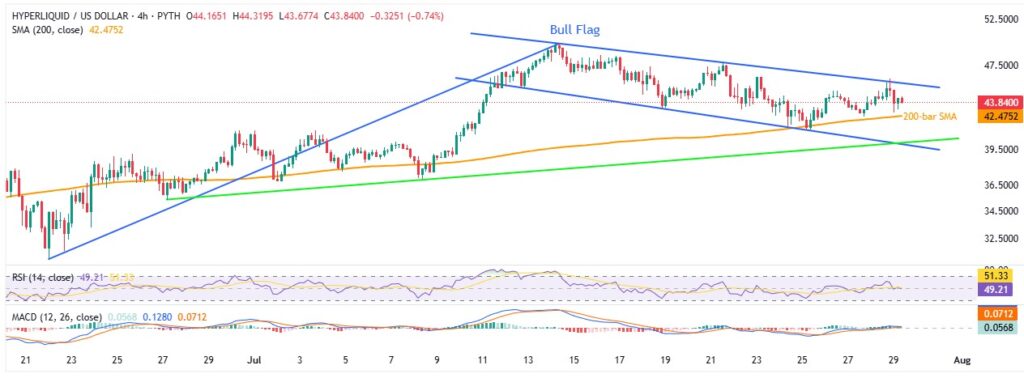
The four-hour chart of the HYPE/USD pair becomes interesting as it portrays a five-week-old “Bull Flag”. The upside bias also takes clues from the pair’s successful trading beyond the 200-bar SMA, upbeat RSI, and bullish MACD signals.
However, a clear break of the flag’s top, currently around $45.70, becomes necessary to witness a theoretical north run towards $65.00. During the anticipated run-up beyond $46.30, the resistance levels discussed on the daily chart could gain the market’s attention.
On the flip side, the 200-bar SMA restricts HYPE’s immediate downside near $42.45. A clear break of the mentioned level could direct sellers toward the said flag’s bottom at $40.00 support.
Apart from the $40.00, the deeper support levels discussed on the daily chart could also challenge the Hyperliquid sellers.
In conclusion, while recent price action has been uneventful, HYPE/USD looks poised for more upside after a solid two-week consolidation, setting the stage for its next big move.


