- Hyperliquid price struggles to extend its four-day losing streak after reaching an all-time high.
- Market’s positioning for FOMC joins short-term support break to lure HYPE sellers.
- A two-month previous resistance line and $45.00 support confluence become tough nuts to crack for sellers.
- Multi-month rising wedge tests HYPE buyers, but short-term bullish channel and upbeat oscillators raise bars for bears.
- Overall outlook remains bullish, despite potential short-term correction.
Hyperliquid (HYPE) price drops for the fourth straight day after hitting an all-time high (ATH), despite lacking momentum near $53.65 on Monday.
The altcoin’s pullback could be linked to the market’s positioning for the U.S. Federal Reserve (Fed) monetary policy announcements, scheduled for September 17. Also favoring the HYPE retreat could be a completion of the race over Hyperliquid’s USDH stablecoin, won by Native Markets.
Also read: Native Markets Wins Hotly Contested Race for Hyperliquid’s USDH Ticker
Further, a pullback in the Hyperliquid market capitalization (market cap) from the record top, even if backed by softer trading volume, also validates the quote’s latest weakness. That said, HYPE’s market cap drops to $17.87 billion, printing a four-day losing streak after hitting an ATH of $19.08 billion, while the daily trading volume remains pressured after $269.15 million, despite challenging a four-day downtrend by press time, according to Santiment.
Still, the coin’s sustained trading beyond a two-month resistance, now support, and multiple Simple Moving Averages (SMAs) keep the HYPE buyers hopeful. On the same line could be a short-term bullish trend channel formation.
Further, the momentum indicators like Moving Average Convergence Divergence (MACD) and the Directional Movement Index (DMI), also known as oscillators, show that trading sentiment is favoring the upside, which in turn challenges the quote’s latest pullback.
With this, the trending altcoin appears to be defending its upside outlook, making the immediate weakness a healthy consolidation.
Hyperliquid Price: Daily Chart Defends Bullish Bias

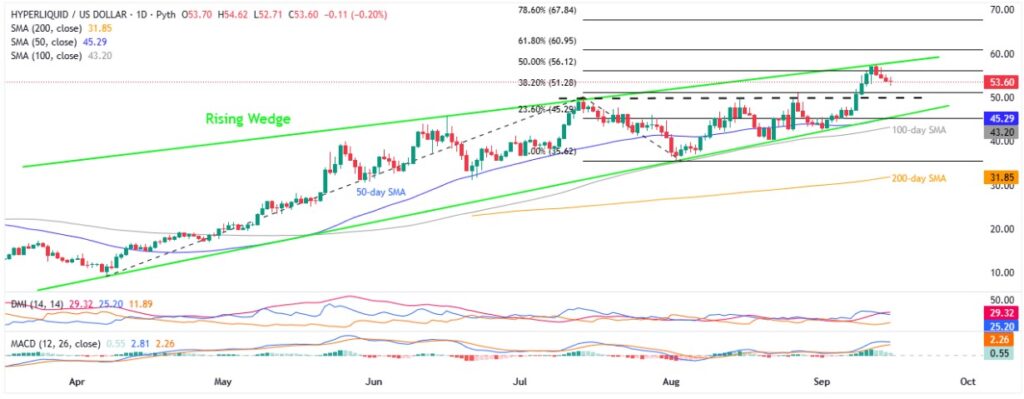
Hyperliquid eases within a five-month “rising wedge” bearish chart formation, despite bullish MACD signals and upbeat DMI clues.
That said, the DMI’s Average Directional Index (ADX in red) hovers around 30.00, quickly followed by the Upmove line (D+ in blue), which is near the 25.00 neutral limit, both indicating strong upside momentum. Meanwhile, the Downmove line (D- in orange) remains near 2.00, signaling very weak downside momentum. Further, the MACD histogram’s bullish signals (green) also add to the HYPE buyer’s optimism.
This highlights a two-month previous resistance line surrounding $50.00 as a short-term key support, which, if broken, will highlight the $45.00 support confluence, a convergence of the 50-day SMA and the aforementioned rising wedge’s lower boundary.
A daily closing beneath $45.00 will confirm the bearish chart pattern, citing the theoretical target of below $5.00, with the 100-day and 200-day SMAs, respectively near $43.20 and $31.80, likely acting as intermediate halts.
On the flip side, the latest peak around $57.40 and the stated wedge’s upper boundary of $58.50, followed by the $60.00 threshold, could test the HYPE bulls.
Beyond that, the 61.8% and 78.6% Fibonacci Extensions (FE) of Hyperliquid’s April-August moves, close to $61.00 and $68.00 in that order, will gain the market’s attention.
Hyperliquid Price: Four-Hour Chart Points To Short-Term Consolidation

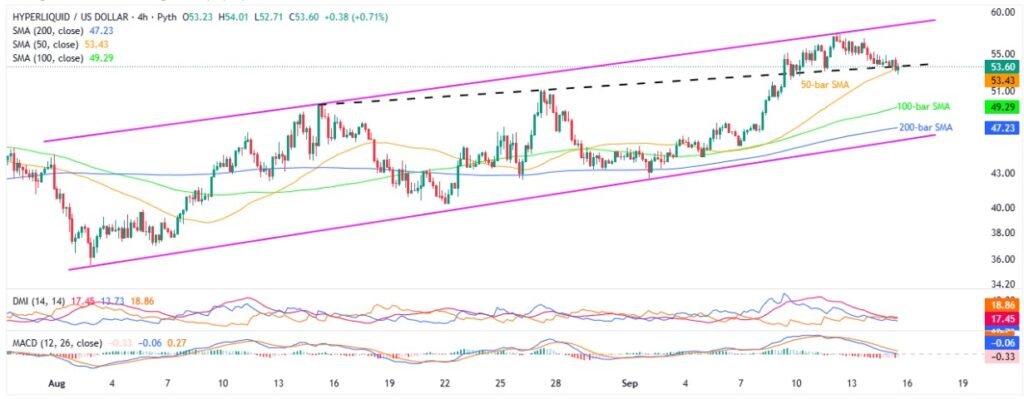
Hyperliquid seesaws around a convergence of the 50-bar SMA and previous resistance line from mid-August, close to $53.50, within a six-week-old ascending trend channel, currently between $45.00 and $58.60.
Also acting as short-term trading filters are the 100-bar and 200-bar SMAs, close to $49.30 and $47.20.
It’s worth noting that the MACD signals have turned red on the short-term chart, suggesting a potential pullback. On the same line, the DMI’s Downmove line (Orange) stays above the ADX and Upmove lines, but beneath the 25.00 neutral level, suggesting a presence of the short-term downside bias despite lacking much strength.
Conclusion
Hyperliquid’s latest pullback goes hand-in-hand with the broad market positioning ahead of top-tier data/events, making it a healthy correction rather than a trend-change signal. Still, a clear downside break of $45.00 might trigger a change in the multi-month upside bias, requiring traders to remain cautious.
Also read: Cryptocurrency Weekly Price Prediction: BTC, ETH, XRP Rally as Markets Bet Big on FOMC Rate Cuts


