- Hyperliquid price extends pullback from key resistance, pressured by bearish momentum indicators.
- HYPE bears face key tests at 100-day SMA and six-week support, with RSI nearing oversold levels.
- Short-term trend stays bearish unless bulls push past $44.00 resistance.
Hyperliquid (HYPE) price drops over 2.0% intraday to $37.47 as sellers extend previous retreat from key resistance heading into Wednesday’s U.S. trading session.
The HYPE bears also justify a downward-sloping but not oversold 14-day Relative Strength Index (RSI) and trace bearish signals from the Moving Average Convergence Divergence (MACD) indicator, reported since late July.
Notably, HYPE’s market cap has been gradually declining since its July 13 peak, standing near $12.51 billion at press time. Trading volume remains subdued, mostly flat since Friday, with the latest figure at $264.94 million, according to Santiment.
Hyperliquid Price: Daily Chart Suggests Further Weakness

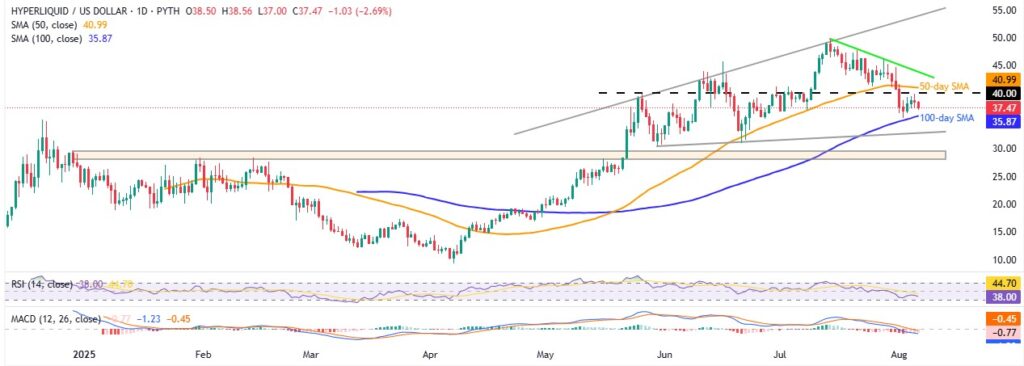
Hyperliquid’s U-turn from a 10-week horizontal resistance joins a descending RSI line and bearish MACD signals since late July to direct sellers toward the 100-day Simple Moving Average (SMA) support of $35.87.
Still, an upward-sloping trend line from May 30, at $32.90, can challenge the HYPE bears before directing to a broad support area comprising levels marked since late 2024, between $29.50 and $28.20. That said, Saturday’s bottom of $35.55 can also act as a short-term downside filter.
It should be observed that the RSI is currently around 37.00, close to the 30.00 oversold limit, which in turn highlights the importance of these support levels.
On the flip side, a daily closing beyond the $40.00 horizontal resistance becomes necessary for the Hyperliquid buyers to challenge the 50-day SMA hurdle around $41.00. Even so, a three-week-old falling trend line could act as the final defense of the sellers around $44.00.
Should the HYPE price stay firmer past $44.00, the odds of witnessing a rally towards the $50.00 threshold, crossing July’s all-time high of $49.84, can’t be ruled out.
Hyperliquid Price: Four-Hour Chart Signals Limited Downside Room

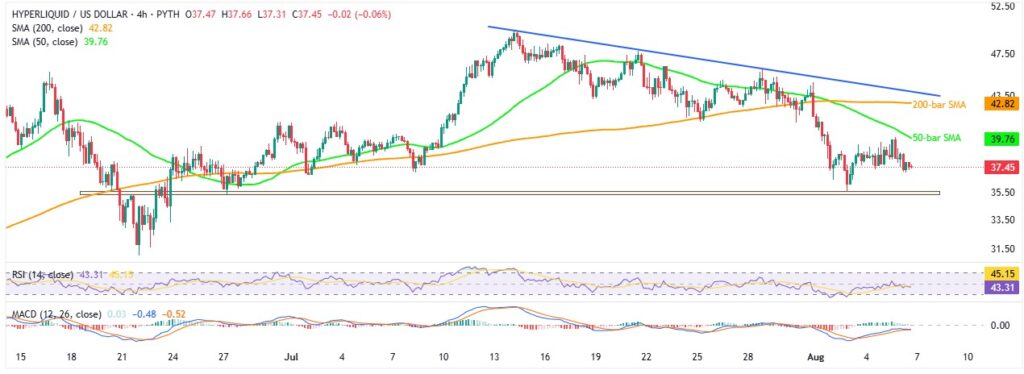
On the four-hour chart, the HYPE sellers appear well-set to revisit a six-week horizontal support of around $35.55-$35.30. Though any further downside will make it vulnerable to drop towards June’s low of near $31.00 and then to the daily chart levels.
Meanwhile, 50-bar and 200-bar SMAs can challenge short-term recovery attempts around $39.80 and $42.85. Following that, a downward-sloping resistance line from mid-July, close to $44.00, will be in the spotlight.
Conclusion
Hyperliquid’s pullback from short-term key resistance, combined with downbeat RSI and MACD signals, suggests further weakness in August. However, a slew of support levels may slow the decline, suggesting HYPE sellers to remain cautious around these technical levels.
Also read: Market Digest: Bitcoin Slips below $114 as Trump Targets EU, India, and Brazil


