- Hyperliquid price drops for the fifth consecutive day, poking the 100-day SMA after reversing from a six-week resistance zone.
- A U-turn from the key resistance area, 50-day SMA breakdown, and bearish signals from RSI, MACD keep HYPE sellers hopeful.
- Multi-month “Bullish Megaphone”, sustained trading past 200-day SMA defends Hyperliquid’s broad bullish trend.
- Short-term downside looks promising, but overall bullish trend prevails unless price breaks $35.50.
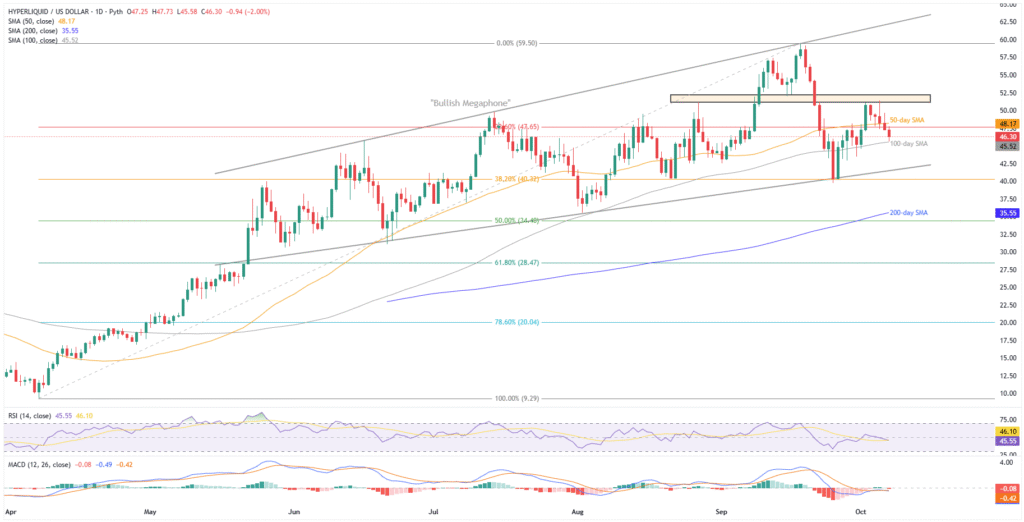
Hyperliquid (HYPE) price prints a five-day losing streak to hit a weekly low around $45.60, before bouncing off the 100-day Simple Moving Average (SMA) support to $46.40 by press time of early Tuesday morning in New York.
In doing so, the altcoin extends pullback from a 1.5-month-old horizontal resistance zone, and slides beneath the 50-day SMA, amid bearish signals from the 14-day Relative Strength Index (RSI) and Moving Average Convergence Divergence (MACD) momentum indicators.
Adding strength to the downside bias is a 12-day high trading volume and a week’s low market capitalization (market cap). According to Santiment, Hyperliquid’s daily trading volume jumps to the highest level since September 25, to $654.67 million, while the market cap hits a six-day low of $15.52 billion by press time.
Still, Hype’s price action since late May portrays a “Bullish Megaphone” trend widening chart pattern, suggesting limited downside room. Also challenging the bears is the quote’s sustained trading past the 200-day SMA.
With this, Hyperliquid is likely to drop in the short term, but a seven-month bullish trend holds.
Also read: ADA, SUI, HYPE, XLM & 17 Other Altcoin ETFs Filed with SEC
Hyperliquid Price: Daily Chart Keeps Buyers Hopeful Beyond $35.50

Hyperliquid’s U-turn from a six-week horizontal resistance, around $51.10-$52.30, and a clear downside break of the 50-day SMA join bearish MACD signals and a sluggish RSI near the 50.00 neutral level to suggest short-term price weakness.
That said, the 100-day SMA support of $45.50 restricts immediate HYPE downside before the “Bullish Megaphone” support of $41.50.
If the altcoin sellers manage to defy the bullish trend-widening formation by slipping beneath the $41.50 support, the $40.00 threshold, and the 200-day SMA level of $35.50 will be the last line of defense for the bulls.
After that, 50% and 61.8% Fibonacci retracements of the HYPE’s April-September rise, respectively near $34.40 and $28.45, might test the bears before driving them to the yearly low.
On the contrary, the 50-day SMA hurdle of $48.20 guards the HYPE’s immediate upside before the multi-week horizontal resistance area near $51.10-$52.30.
In a case where Hyperliquid stays firmer past $52.30, the all-time high near $59.40 and the $60.00 threshold could lure the bulls before the stated megaphone’s top surrounding $62.35.
Hyperliquid Price: Four-Hour Chart Lures Short-Term Sellers

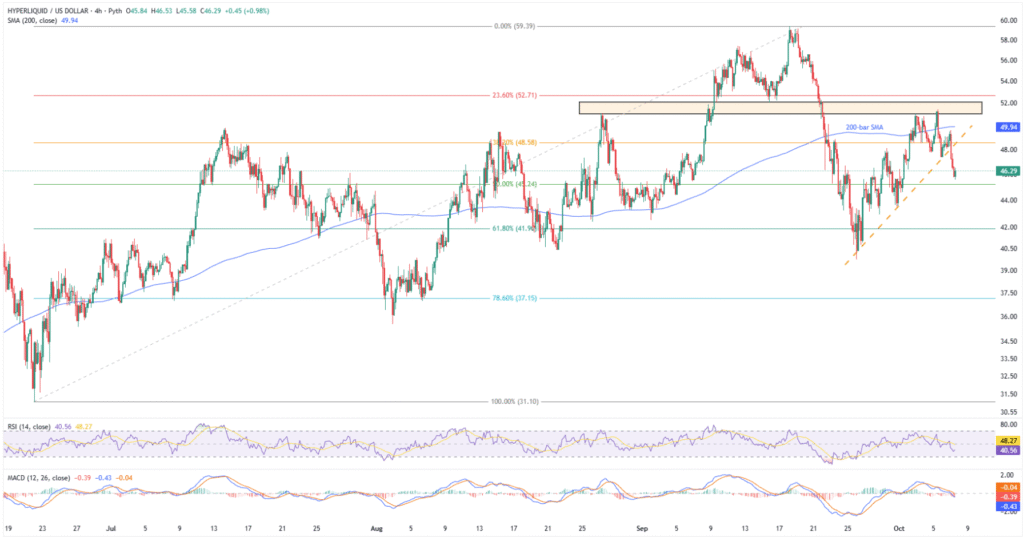
On the four-hour chart, Hyperliquid’s reversal from the multi-week resistance zone joins the downside break of the 200-bar SMA and an 11-day-old trend line support, now resistance, to attract short-term bearish bias.
This suggests a gradual fall toward the 61.8% and 78.6% Fibonacci ratios of the quote’s June-September upside, close to $41.90 and $37.15, as well as the $40.00 threshold, before highlighting the daily chart’s deeper levels.
Alternatively, the immediate support-turned-resistance line and the 200-bar SMA, respectively near $48.60 and $50.00, could restrict the HYPE’s short-term recovery before the higher levels discussed on the daily chart.
Conclusion
Hyperliquid faces strong resistance, with recent rejections and bearish signals hinting at a short-term dip. But as long as it stays within the “Bullish Megaphone” pattern, and holds above the 200-day SMA, the bigger bullish trend remains intact. Hence, HYPE traders are advised to keep an eye on these key levels.


