- Litecoin snaps two-day winning streak, marks third rejection from 200-day SMA resistance since May.
- LTC falters at 200-day SMA as RSI cools, highlighting key support at 50-day, 100-day SMA confluence.
- LTC/USD’s short-term bullish channel limits downside, while $78–$113 range sets the broader trading path.
Litecoin (LTC/US Dollar) posts its first daily loss in three sessions, despite briefly rebounding to $93.80 during Tuesday’s U.S. trading hours.
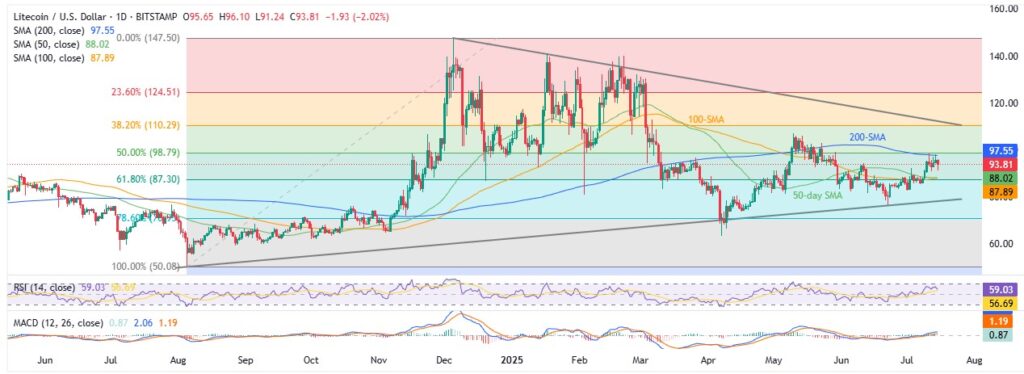
The drop marks LTC’s third failure since May to break above the 200-day Simple Moving Average (SMA), now reinforced by a pullback in the 14-day Relative Strength Index (RSI). This downside bias shifts focus toward key support at the confluence of the 50-day and 100-day SMAs.
However, bullish signals from the Moving Average Convergence Divergence (MACD) indicator and a short-term ascending trend channel still offer hope to LTC/USD bulls, especially as the pair continues to trade within its established multi-month range.
LTC/USD: Daily chart lures sellers

Litecoin faces renewed pressure after a third rejection from the 200-day SMA at $97.55 and a pullback in the 14-day Relative Strength Index (RSI) toward the neutral 50.00 mark. This strengthens the case for a drop toward key support at the 100-day and 50-day SMAs, converging near $88.00–$87.88.
If that zone breaks, LTC/USD may test the 11-month-old ascending support trendline near $78.00 — the bulls’ last stronghold. A deeper slide could expose June’s low at $76.75 and the April 2024 bottom around $63.20.
Alternatively, a daily close above the 200-day SMA could open the door to $100.00 and May’s high near $107.00. That said, a confirmed breakout above the descending trendline from December 2024 — now near $113.00 — would strengthen bullish momentum, with targets at the yearly high of $141.00 and the December peak at $147.23.
LTC/USD: Four-hour chart tests bearish bias

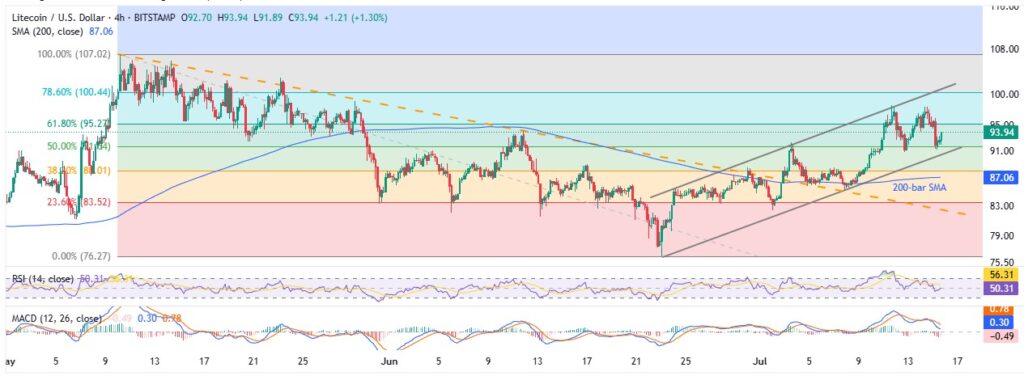
While the daily chart shows consolidation, the four-hour chart signals short-term bullish momentum with a three-week-old ascending channel between $90.40 and $101.00.
Supporting the positive outlook is Litecoin’s sustained breakout above the 200-bar SMA and a descending resistance line from early May, now serving as support near $87.00 and $82.70, respectively.
A break below $82.70 could drag prices toward June’s low of $76.25 and beyond, while a break above $101.00 would expose May’s high at $107.00, in line with the bullish levels seen on the daily chart.
To sum up, LTC/USD may see short-term dips, but the broader bullish structure remains intact—challenging the symmetrical triangle pattern formed by trendlines from 2024.


