- Litecoin price breaks multi-month-old resistances to hit a five-month high.
- Overbought RSI, multiple upside hurdles may test LTC rally targeting 2024 peak.
- Upbeat MACD signals, sustained trading past key SMAs keep buyers hopeful of witnessing gradual run-up.
- Pullback remains elusive beyond $122.00; $97.00 appears to be the key support.
Litecoin (LTC) price jumped to its highest level for the first time since March 2025, up 5.63% intraday near $128.00 during Tuesday’s session. The LTC bulls cheered the upside break of the multi-month-old resistance.
That said, LTC reported the daily trading volume of 1.58 billion with a market cap of 9.34 billion by the press time.
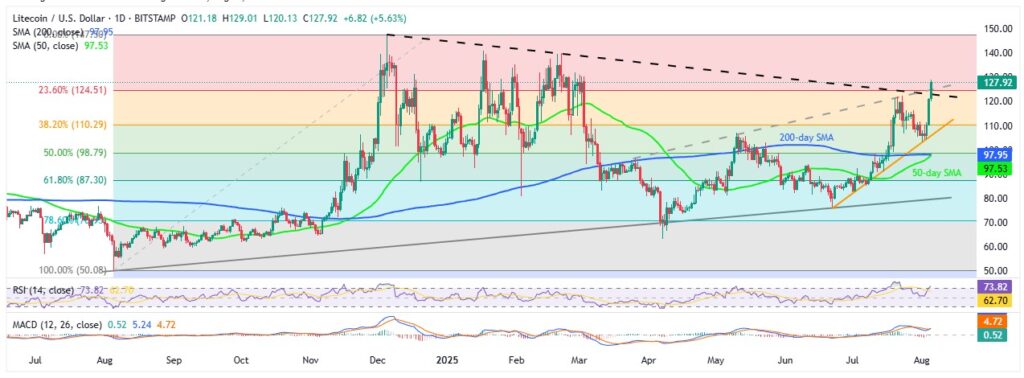
A clear breakout above key resistance levels, supported by bullish signals from the Moving Average Convergence Divergence (MACD) indicator, gives Litecoin buyers reason to target the previous yearly high. However, overbought conditions on the 14-day Relative Strength Index (RSI) suggest the move may be gradual and marked by pullbacks, rather than a sharp rally.
Litecoin Price: Daily Chart Suggests Further Upside

A successful break of an ascending resistance line from late March, now support around $125.00, and piercing of the eight-month-old resistance-turned-support surrounding $122.00, bolsters the LTC’s bullish bias.
It’s worth noting, however, that the multiple tops marked since November 2024 around $140.00 could join the overbought RSI conditions to challenge short-term buyers on their way to the previous yearly top surrounding $147.00, and then to the $150.00 threshold.
In a case where Litecoin remains firmer past $150.00, the late 2021 peak surrounding $167.00 and the $200.00 round figure will be in the spotlight.
Alternatively, LTC pullback may aim for $125.00 and remains elusive unless breaking $122.00 resistance-turned-support line.
Following that, an ascending trend line support from late June, around $106.00, and a convergence of the 200-day and 50-day Simple Moving Averages (SMAs), near $97.00-$98.00, should lure the sellers.
Above all, Litecoin’s bearish trend remains off the table unless it breaks a year-long upward-sloping trend line surrounding $79.00.
Litecoin Price: Four-Hour Chart Signals Bumpy Road Towards The North

With comparatively more overbought conditions of the RSI on the four-hour chart than the daily chart, the LTC might slow down on its north run despite crossing a fortnight-old horizontal resistance surrounding $122.00.
Still, the quote’s sustained trading beyond the key SMAs and bullish MACD signals suggests a gradual run-up toward the 50% and 61.8% Fibonacci Extensions (FE) of Litecoin’s June-July moves, respectively, near $131.00 and $138.55.
Should the LTC buyers remain in the driver’s seat past $138.55, the 78.6% and 100% FE levels, close to $150.00 and $166.00 in that order, will be on their radars.
On the downside, a pullback beneath $122.00 could drag Litecoin prices to the 100-bar SMA support of $112.63 and then to a six-week-old ascending trend line support surrounding $106.00. That said, the 200-bar SMA of $102.92 acts as the final defense of the LTC buyers before giving control to the bears and highlighting deeper technical supports discussed on the daily chart.
Conclusion
Litecoin’s successful break of the multi-month-old resistance allows bulls to aim for the higher levels and stretch its recent peak. Still, the RSI’s overbought conditions may trigger interim pullbacks in the prices. Investors are advised to stay cautious near key resistance zones.
Also read: Market Digest: Bitcoin Holds Near $114,500 as Markets Recover from Tariff Shock


