- Litecoin price struggles to defend the first weekly gains in four, as the 50-day SMA tests bulls.
- RSI and MACD support LTC’s three-week resistance breakout, keeping buyers optimistic within a six-month bullish channel.
- Convergence of a multi-month bullish channel’s bottom, 200-day SMA highlights $98.00 as the key support.
- Multiple strong support levels limit short-term downside risks, reinforcing LTC’s broader bullish structure.
- Litecoin may see a pullback, but its overall recovery trend stays intact.
Litecoin (LTC) price drops 2.5% intraday to $112.20 on Monday, snapping its three-day winning streak after posting the first weekly gain in four.
The altcoin’s latest pullback likely stems from another failed attempt to break above its 50-day Simple Moving Average (SMA).
Still, LTC defends the previous breakout of a three-week resistance level that supported last week’s gains. Further, the 14-day Relative Strength Index (RSI) and Moving Average Convergence Divergence (MACD) momentum indicators also suggest the continuation of the recent recovery.
Meanwhile, Litecoin’s daily trading volume jumps to a three-day high of $571.20 billion, validating the latest pullback, whereas the market capitalization also retreats to $8.63 billion, according to Santiment.
Hence, the LTC’s short-term pullback appears looming, but the six-month bullish trend channel keeps the overall recovery bias intact.
For more news details, check out our Coin Bytes.
Litecoin Price: Daily Chart Suggests Further Upside

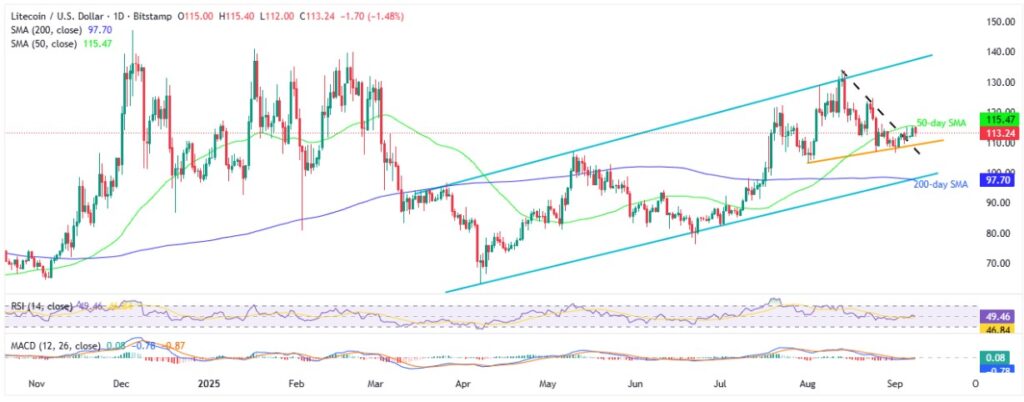
Even though the 50-day SMA, steady RSI, and strong trading volume point to a pullback, LTC’s defense of last week’s breakout joins slightly bullish MACD signals to keep buyers optimistic.
This highlights a week-long rising trend line support, near $110.00, as an immediate challenge to the LTC sellers before the previous resistance line from August 13, close to $107.00.
Below that, the previous monthly low near $103.00 and the $100.00 threshold could limit the altcoin’s further downside before shifting the market’s attention to the $98.00 key support, comprising the 200-day SMA and the lower boundary of a six-month bullish channel.
It’s worth noting, however, that the quote’s sustained weakness past $98.00 makes it vulnerable to slump toward June’s bottom, surrounding $76.00, and the yearly low of $63.20.
On the flip side, a daily closing beyond the 50-day SMA hurdle of around $115.50 could allow buyers to aim for a late August swing high near $124.00 and the previous monthly high around $134.00.
Still, the multi-month bullish channel’s top near $138.00 will be a tough nut to crack for the LTC bulls past $134.00, a break of which will allow them to aim for the yearly peak of $141.00 and late December top surrounding $147.00, as well as the $150.00 mark.
Litecoin Price: Four-Hour Chart Defends Bullish Bias

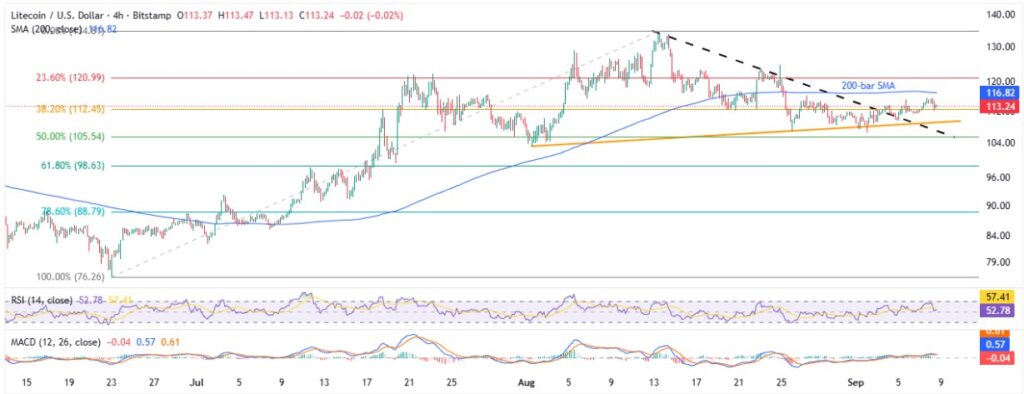
On the four-hour chart, Litecoin buyers face a stronger support from the RSI, while also bearing the burden of the sluggish MACD signals, both of which join the previous week’s breakout to suggest a slower grind toward the north.
Notably, the 200-bar SMA near $117.00 guards the immediate LTC upside, ahead of the higher levels marked on the daily chart.
Alternatively, the 50% and 61.8% Fibonacci retracements of its June-August rise, respectively near $105.50 and $98.60, act as additional downside filters apart from the daily chart levels.
Conclusion
As repeated failures to cross the 50-day SMA hurdle join mixed momentum indicators, a short-term Llitecoin pullback appears brewing. However, last week’s bullish breakout and the six-month ascending trend channel keep the overall upside bias intact.
Also read: Cryptocurrency Weekly Price Prediction: BTC, XRP Rebound, But ETH Lags, amid Fed Rate Cut Buzz


