- Litecoin price remains under pressure at a three-month low, down for the third straight day.
- Key EMA breakdown keeps LTC sellers confident.
- Lower Bollinger Band, ascending trend line from April could test bears amid oversold Stochastic.
- LTC at a crossroads, risks a deeper fall on a clear break of $100.00.
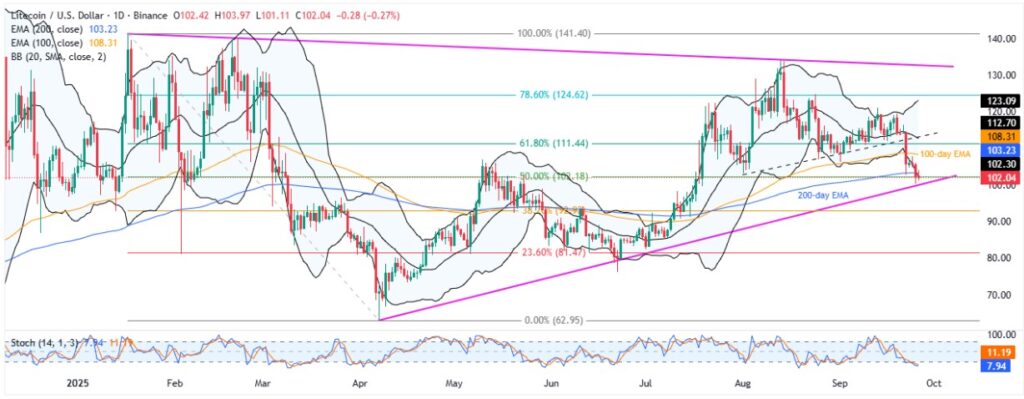
Litecoin (LTC) drops for the third straight day, hitting $102.00 early Friday in New York. In doing so, the altcoin erases Thursday’s corrective bounce off a three-month low and stays below the key 200-day Exponential Moving Average (EMA), signaling ongoing downside pressure.
Also read: Cryptocurrency Weekly Price Prediction: BTC Holds, But ETH & XRP Dip as Dollar Edges Up
Notably, the lower Bollinger Band (BB) allows a breathing space to the LTC bears at a multi-month low. Meanwhile, the Stochastic momentum indicator is deeply oversold, sitting well below the 20.00 limit, hinting at potential short-term consolidation in prices.
Upbeat trading volume also adds strength to the downside bias, even as the LTC’s market capitalization (market cap) shrinks. According to Santiment, Litecoin’s daily trading volume remains sturdy at a three-day high marked on Thursday, close to $662.69 million, whereas the market cap drops to the lowest since July 18, at $7.75 by press time.
Still, an ascending trendline from early April, close to the $100.00 psychological magnet, could join the oversold Stochastic to give a tough fight to the bears before giving them control.
Hence, Litecoin stands at a critical crossroads, with bears currently holding the upper hand.
Litecoin Price: Daily Chart Suggests Further Downside

Even though the lower Bollinger Band (BB) jostles with the LTC sellers amid the oversold Stochastic, the quote’s sustained trading beneath the 100-day and 200-day EMAs, coupled with the early-month break of the ascending trend line from August, favors bears.
Hence, the quote may seesaw around the lower BB and 50% Fibonacci retracement of Litecoin’s January-April downside, near $102.20, as well as the $102.00 and $101.00 thresholds, to catch a breath.
Still, bears appear determined to crack an ascending trend line from early April, forming part of a multi-month triangle formation, close to the $100.00 threshold.
Below that, the 38.2% and 23.6% Fibonacci ratios, respectively near $92.93 and $81.47, could attract the LTC sellers before highlighting June’s low of $76.32 and the yearly bottom surrounding $63.11.
On the contrary, the 200-day and 100-day EMAs, around $103.25 and $108.30 in that order, could restrict short-term LTC rebound.
Beyond that, the middle BB will join the previous support line from August to offer a tough nut to crack for the Litecoin bulls around $112.70.
In a case where the LTC price remains firmer past $112.70, the odds of witnessing a successive rally toward the monthly high of $121.17 and the 78.6% Fibonacci retracement level of $124.62 can’t be ruled out.
Litecoin Price: Four-Hour Chart Highlights Immediate Support

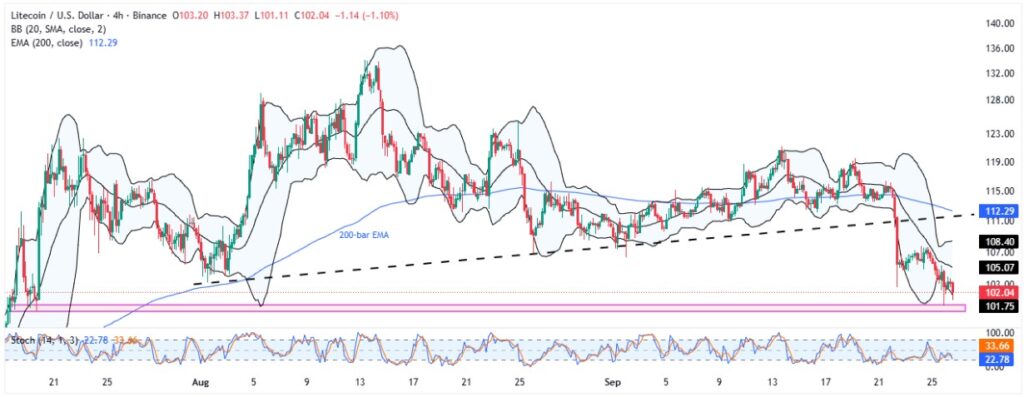
On the four-hour chart, lows marked during mid-July, around $101.70-$99.70, join oversold Stochastic to restrict immediate LTC downside before highlighting the deeper levels discussed on the daily chart.
Meanwhile, the Bollinger Bands and previous support line from August can test immediate Litecoin rebound. However, the 200-bar EMA level of $112.29 acts as an additional upside filter, apart from the daily chart’s levels.
Conclusion
Litecoin remains at a crucial crossroads, with bears holding the upper hand despite oversold conditions and immediate support near $100. Unless the price breaks above the key $112.70 resistance, traders should remain cautious and favor selling opportunities as the risk of reversing April’s recovery persists.
Also read: Crypto Morning News: Bitcoin Sinks to 109K as Dollar Rises on Growth and Inflation Fears


