- Litecoin price remains flat after snapping a two-day rebound, keeping the 200-day SMA breakdown for the fifth consecutive day.
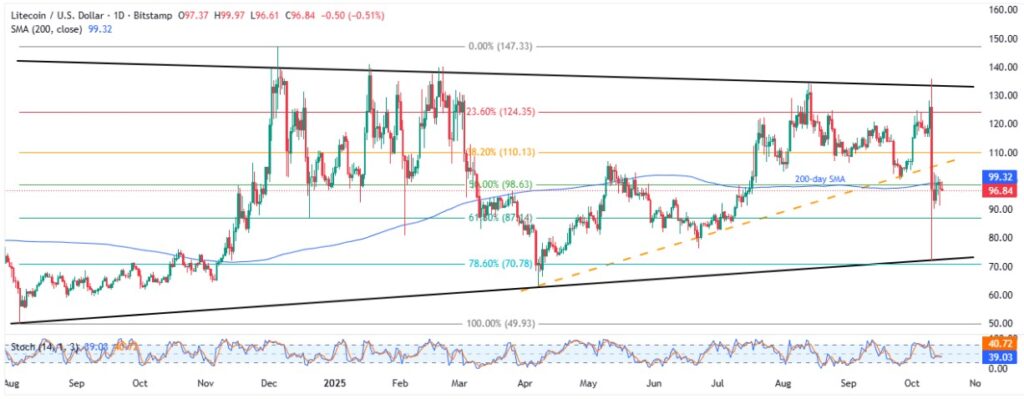
- LTC slid beneath the multi-month support line and the 200-day SMA to lure bears within a 14-month symmetrical triangle.
- Downbeat Stochastic suggests a gradual south-run, with intermediate consolidation in Litecoin prices.
- Broad consolidation pattern stays, despite potential short-term downtrend.
Litecoin (LTC) price seesaws around $97.00 early Wednesday morning in New York, staying beneath the 200-day Simple Moving Average (SMA) for the fifth consecutive day while defending a 14-month symmetrical triangle.
Apart from Friday’s 200-day SMA, the quote’s sustained trading beneath an ascending trend line from April adds strength to the bearish bias.
However, the stochastic momentum indicator signals at a slowing downside price action, which in turn suggests a gradual south-run within a multi-month triangle formation, with intermediate consolidation phases.
Notably, softer trading volume and market capitalization (market cap) also hint at weaker trading participation following Friday’s slump. According to Santiment, Litecoin’s daily trading volume and market cap decline for the second consecutive day to $1.06 billion and $7.42 billion in that order.
With this, the LTC bears are likely to keep the reins within a broad triangle formation. Read details!
Litecoin Price: Daily Chart Suggests Further Downside

Litecoin’s sustained trading below the previous support line from April and the 200-day SMA keeps sellers optimistic even as the nearly oversold Stochastic suggests a short-term consolidation in prices.
Should the quote’s corrective bounce manage to stay beyond the 200-day SMA and the aforementioned support-turned-resistance, respectively near $99.35 and $106.70, the 38.2% Fibonacci retracement of the LTC’s August-December 2024 upside, near $110.15, will be eyed.
That said, Litecoin’s successful run-up beyond $110.15 enables it to aim for the 23.6% Fibonacci ratio of $124.35 and the stated triangle’s top, surrounding $133.60, quickly followed by Friday’s peak of $135.86.
In a case where the LTC remains firmer past $135.86, a strong rally toward the latest 2024 top near $147.25 can’t be ruled out.
Alternatively, June’s high near $94.15 and 61.8% Fibonacci retracement level of $87.15, also known as the “Golden Fibonacci Ratio”, can attract short-term LTC bears.
Following that, June’s low of $76.25 and the aforementioned triangle’s bottom of $72.60 appear to be tough nuts to crack for Litecoin sellers.
That said, a daily closing beneath $72.60 makes the altcoin vulnerable to slump toward the yearly low of $63.21 and the late 2024 bottom of $50.00.
Litecoin Price: Four-Hour Chart Highlights Immediate Resistance

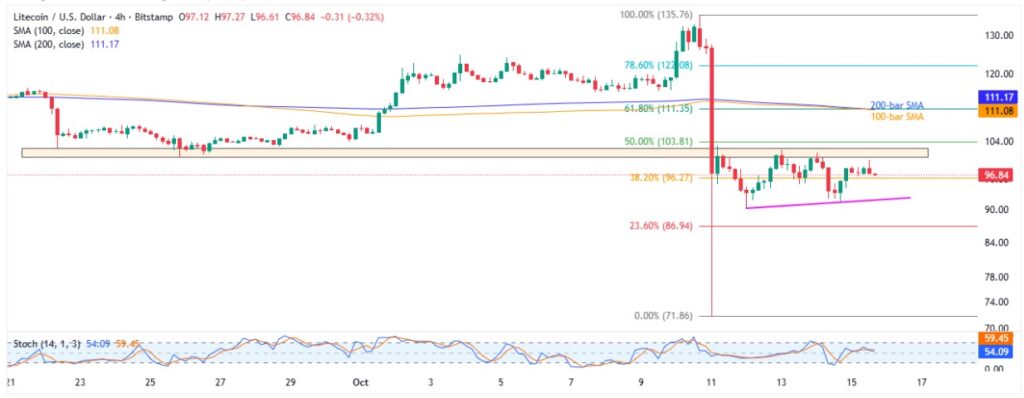
On the four-hour chart, Litecoin stays beneath a three-week horizontal resistance area, between $102.50 and $100.40.
Adding strength to the downside bias is an absence of overheated signals from Stochastic and the quote’s sustained trading beneath the $111.10-$111.40 resistance zone comprising the 61.8% Fibonacci retracement of its Friday-Saturday downside, and a convergence of the 100-bar and 200-bar SMAs.
Meanwhile, a three-day support near $91.70 acts as an immediate rest-point for the LTC bears during further downside, before highlighting the daily chart’s deeper levels.
Alternatively, an upside clearance of the $111.40 hurdle could negate a short-term downside bias and underpin the LTC’s rise, targeting Friday’s peak of $135.86 and higher levels discussed on the daily chart.
Conclusion
While Litecoin remains trapped within a broad consolidation pattern, an overheated momentum indicator, namely the stochastic, limits LTC’s short-term price action. Despite the lack of momentum, the technical setup continues to favor bears, with increasing odds of facing a southward move toward the lower boundary of the 14-month symmetrical triangle.
Also read: Cryptocurrency Weekly Price Prediction: BTC, ETH & XRP Plummet under U.S. Risk Pressure


