- SYRUP stays under pressure after soaring 20% on Friday’s Upbit listing and hitting a fresh ATH.
- Clear break of 50-day SMA, monthly resistance keeps bullish bias intact despite recent pullback in prices.
- Short-term resistance tests SYRUP/USD bulls near $0.6000, while pullback remains unimportant beyond $0.4080.
Maple Finance’s token SYRUP (SYRUP/USD) drops 3.50% intraday to $0.5475 early Monday as bulls pare Friday’s heavy run-up amid market’s cautious optimism driving major cryptocurrencies and testing gains of altcoins. That said, SYRUP jumped to an all-time high (ATH) of $0.6620 on Friday as traders cheered the coin’s listing on Upbit exchange.
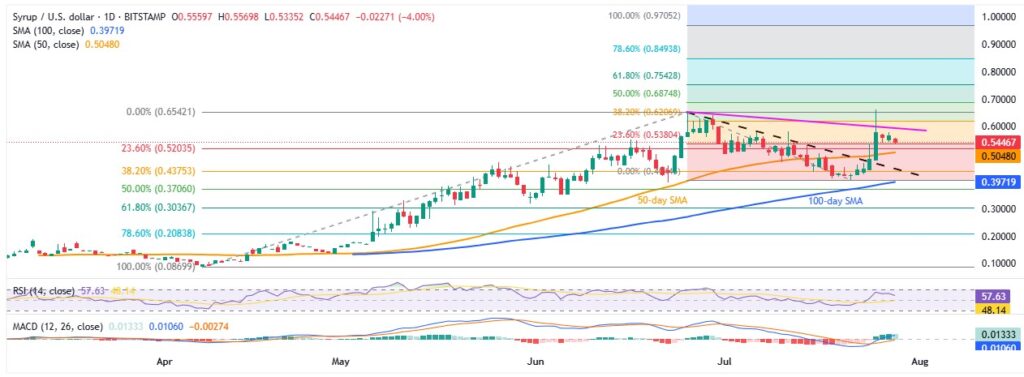
The listing optimism fuelled SYRUP/USD prices past a month-long resistance line and 50-day Simple Moving Average (SMA), adding strength to the upside bias. Additionally, bullish signals from the Moving Average Convergence Divergence (MACD) indicator and upbeat conditions of the 14-day Relative Strength Index (RSI) further backed the SYRUP buyers.
However, failure to provide a daily closing beyond the descending resistance line from June seems to have triggered the quote’s latest retreat from its record top.
SYRUP: Daily Chart Defends Bullish Bias

A clear break of the descending trend line from late June and the 50-day SMA, coupled with bullish MACD signals and the RSI print of 65.00, portrays the SYRUP’s upside bias. In doing so, the bulls can ignore the quote’s failure to cross a downward-sloping resistance line from June 25, close to $0.6000 by the press time.
Even if the quote stretches the post-Friday pullback beneath the 50-day SMA of $0.5475 and the resistance-turned-support line of $0.4520, the monthly low of near $0.4050 and the 100-day SMA of $0.3970 will challenge the sellers before giving them control. Even so, the late May swing low of near $0.3180 can act as an additional downside filter.
Alternatively, SYRUP buyers need a daily closing beyond the aforementioned resistance line, close to $0.6000, to tighten their grips. Also, SYRYP June’s peak of $0.6500 and the latest ATH of $0.6620 act as the upside filter.
Following that, the 61.8% and 78.6% Fibonacci Extension (FE) of the quote’s April-July moves, near $0.7545 and $0.8495, could test the SYRUP/USD buyers ahead of directing them to the 100% FE level of $0.9705 and ultimately to the $1.0000 psychological magnet.
SYRUP: Four-Hour Chart Appears Less Positive

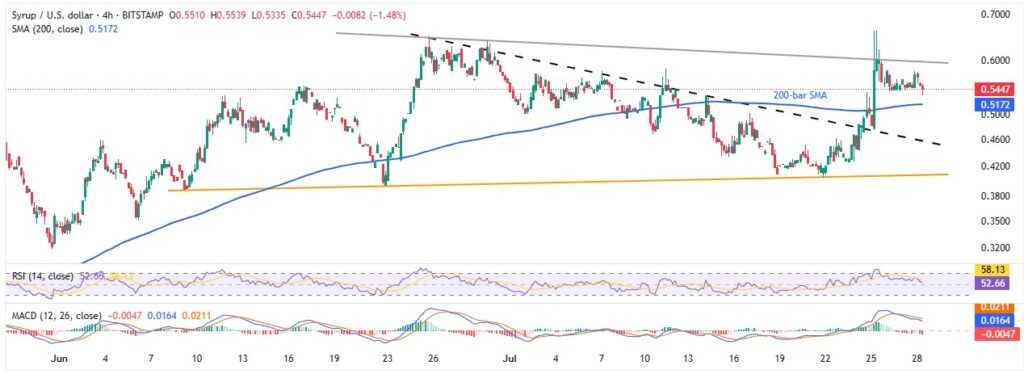
While the daily chart favors the SYRUP buyers, the four-hour chart highlights the quote’s recent failure to cross a descending trend line from June 25, close to $0.6000 by the press time.
The same joins a pullback in the RSI from the overbought territory to suggest further consolidation toward the 200-bar SMA support of $0.5170 and then to the previous resistance line of near $0.4520.
It’s worth noting that an ascending trend line from June 09, close to $0.4080, acts as the final defense of the SYRUP/USD buyers before highlighting the daily chart levels.
On the flip side, a clear break of $0.6000 becomes necessary to convince the return of SYRUP buyers. Following that, the latest peak of $0.6620 and other resistance levels discussed on the daily chart will be eyed during further upside.
In a nutshell, Maple Finance’s SYRUP could witness short-term consolidation before continuing its upside momentum.


