- Monero price rebounds from lowest since April, snapping three-day losing streak.
- Oversold Stochastic and 61.8% Fibonacci retracement (October 2024–May 2025 rally) favor XMR’s corrective bounce.
- Clear upside break of 200-day SMA becomes necessary to restore buyer’s confidence.
- Monero’s short-term recovery appears imminent, but odds of reversing two-month bearish trend remain dismal.
Monero (XMR) price climbs 1.9% during Wednesday’s trading session at $258.00, portraying a renewed buying interest after a three-day losing streak.
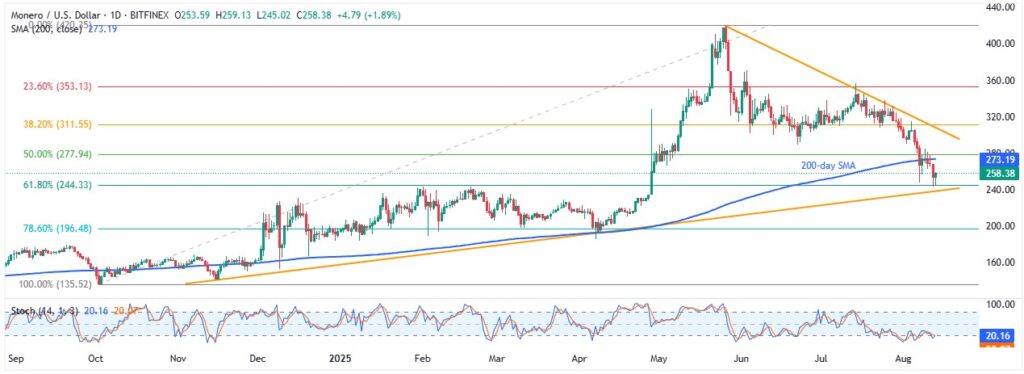
In doing so, the Altcoin recovers from the lowest level since April 28, finding support at the 61.8% Fibonacci retracement of its October 2024 to May 2025 upside move, also known as the “Golden Fibonacci Ratio”. Adding strength to the corrective bounce is the oversold conditions of the Stochastic indicator, poking the 20.00 oversold signal at the latest.
However, the XMR’s trading volume, according to Santiment, remains weakest in a month on Wednesday, at $95.47 million, suggesting lower support to the latest rebound. That said, the market cap traces the prices and recovers from a four-month low to $4.71 billion.
Notably, Monero’s continued trading below key Simple Moving Averages (SMAs) keeps sellers hopeful of breaking a multi-month support line — a move needed to erase its yearly gains.
Monero Price: Daily Chart Favors Corrective Bounce

Monero’s rebound from the 61.8% Fibonacci retracement level takes clues from the below 20.00 Stochastic line, suggesting oversold market conditions.
The recovery moves, however, need to cross the 200-day SMA hurdle of $273.20 on a daily closing basis to restore the upside momentum.
Still, June’s low of near $290.00, the $300.00 threshold, and an 11-week-old resistance line surrounding $310 will be the final defenses of the XMR bears.
Following that, tops marked in June and July, respectively, near $357.00 and $371.00, as well as the $400.00 round figure, will lure the Monero buyers.
On the flip side, an upward-sloping trend line from November 2024, close to $237.00, acts as an additional downside filter for the XMR, even if it breaks the “Golden Fibonacci Ratio” support level of $244.00.
In a case where Monero posts a daily closing beneath $244.00, the odds of witnessing a fall towards the 78.6% Fibonacci ratio and then to the late 2024 bottom, close to $196.00 and $135.00 in that order, can’t be ruled out.
Monero Price: Four-Hour Chart Highlights Triangle

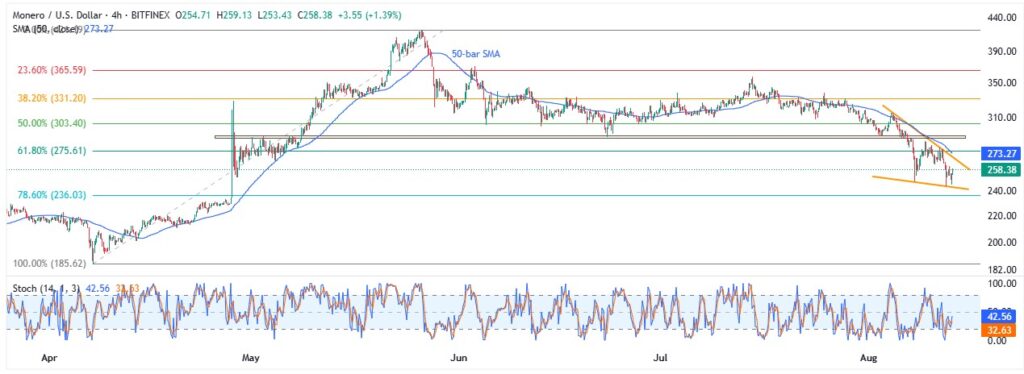
A week-long descending triangle between $243.00 and $269.00 gains the Monero buyer’s attention on the four-hour chart, as the Stochastic recovers from the oversold limit to currently around 42.00.
If the XMR price rises past $269.00, which is less likely, the 50-bar SMA and a 3.5-month-old horizontal area, respectively near $273.00 and $288.00-$290.00, could test the buyers before directing them to the higher levels discussed on the daily chart.
Alternatively, a clear break of $243.00 support could fetch Monero to the 78.6% Fibonacci retracement of its April-May upside, near $236.00, a break of which will highlight April’s bottom of $185.00 and the daily chart support levels for the XMR bears.
Conclusion
Monero’s key support and oversold Stochastic indicator drive a corrective bounce, but the price needs validation from the 200-day SMA to convince buyers.
Until then, a slow dip to consolidate early 2025 gains appears more likely, which in turn highlights a nine-month support set to decide if XMR’s yearly gains hold or fade.
Also read: Market Digest: Bitcoin Holds Near $119K as Soft CPI Data and Peace Talks Shape Sentiment


