- NEAR Protocol price fades rebound from two-month low, stuck within two bearish channels.
- NEAR stays weak below key SMAs, with bearish patterns and momentum signals backing sellers.
- NEAR/USD bulls must cross 200-day SMA to regain control.
NEAR Protocol (NEAR/USD) fell over 2.0% intraday to around $2.14 during Friday’s European session, continuing Thursday’s pullback while reversing the mid-week bounce from a two-month low.
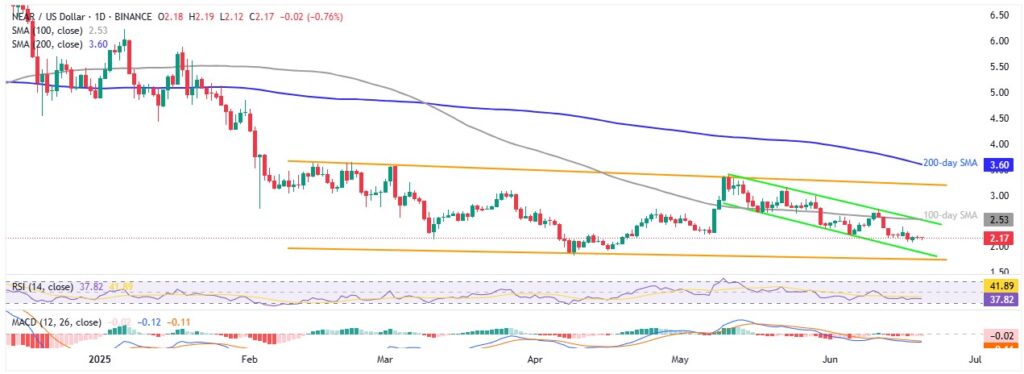
The pair remains within a four-month descending trend channel and a shorter falling channel formed since May 11. Bearish signals persist: the 14-day Relative Strength Index (RSI) keeps dropping (but isn’t oversold), the Moving Average Convergence Divergence (MACD) shows weakness, and the price stays below both the 100-day and 200-day Simple Moving Averages (SMA) — all adding to downward pressure.
NEAR/USD: Daily chart signals gradual south-run

Source: Tradingview
NEAR remains trapped within a five-week bearish channel and a larger downtrend since mid-February. Repeated failures to rise above the 100-day and 200-day SMAs keep sellers in control.
However, the RSI near oversold levels and recent social buzz helped trigger a small rebound from the four-month low. Despite this, NEAR prices still trade within the short-term bearish range of $1.90 to $2.53, with the 100-day SMA reinforcing the channel’s upper boundary.
On a medium-term scale, NEAR is limited by a broader channel between $1.76 and $3.25, with the 200-day SMA at $3.60 acting as strong resistance for sellers.
Sluggish MACD signals and the RSI near oversold suggest possible bounces off the lower support lines at $1.90 and $1.76, making them critical to watch.
Meanwhile, a clear break above the 200-day SMA ($3.60) could push NEAR toward January’s swing highs near $5.88 and $6.23.
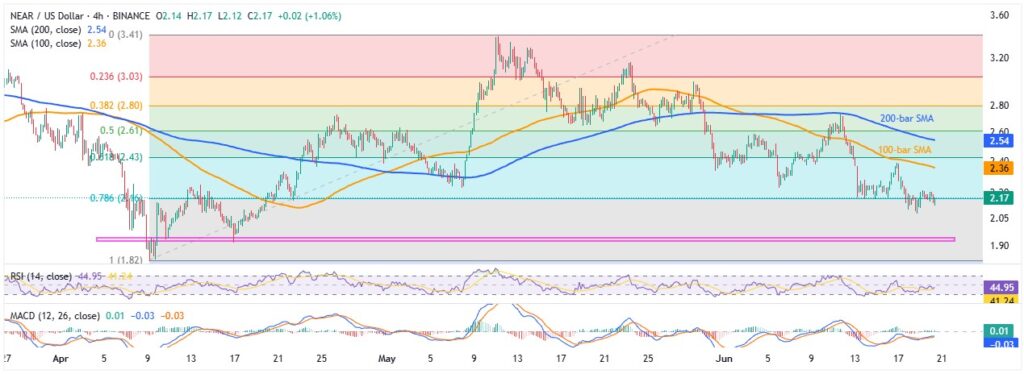
NEAR/USD: Four-Hour chart justifies bearish bias

Source: Tradingview
Like the daily chart, the four-hour chart shows NEAR consistently trading below the 100-bar SMA of near $2.36 and the 200-bar SMA surrounding $2.54, making these levels key resistances during any corrective bounce.
Additionally, a horizontal support zone near $1.93–$1.94, marked during April, acts as another important support level for sellers alongside those noted on the daily chart.
The RSI on the four-hour chart is relatively stronger than on the daily chart, but the MACD signals are more uncertain, indicating short-term consolidation.
Overall, NEAR is likely to stay within the two bearish channels and may retest its yearly low while gradually trending downward.


