- Omni Network skyrockets 80% in a single day, reaching a 4.5-month high to justify bullish breakouts.
- OMNI rejects 16-week bearish channel, confirms falling wedge breakout, and clears 100-day SMA to lure buyers.
- Overbought RSI joins 200-day SMA hurdle to challenge further upside.
- OMNI bulls eye $6.81 breakout to reverse 47% YTD loss, with $2.85 acting as nearby support.
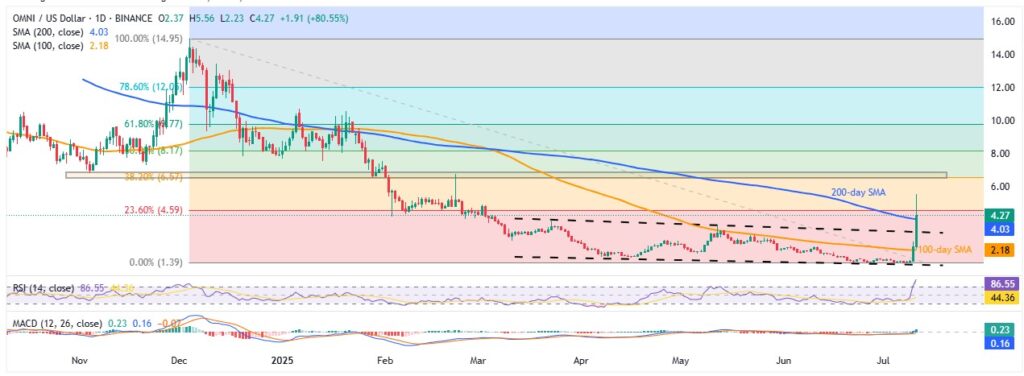
Omni Network (OMNI/USD) soared 80% on Friday, hitting its highest point since late February! Despite a brief dip from $5.56 to $4.27 early in the U.S. session, strong crypto market momentum and a powerful technical breakout kept bulls excited.
Key technical factors include a clear rejection of a 16-week bearish trend channel and confirmation of a seven-month “Falling Wedge” bullish pattern, which attracted buyer interest. Additionally, bullish signals from the Moving Average Convergence Divergence (MACD) and a previous advance above the 100-day Simple Moving Average (SMA) have supported the momentum.
However, the 14-day Relative Strength Index (RSI) remains well above the overbought threshold of 70, and prices are currently testing the critical 200-day SMA, indicating a potential tussle between buyers and sellers.
OMNI/USD: Daily chart highlights challenges for bulls

OMNI/USD broke out of its bearish channel since March and climbed above the 100-day SMA, pushing past the key 200-day SMA at $4.03. But with RSI overbought, prices pulled back, making a daily close above $4.03 crucial to avoid profit-booking.
With this in mind, next resistance for OMNI sits between $6.55 and $6.80, an area kept since November 2024. Breaking this could set the stage for a run toward $10 and beyond, eyeing last year’s $10.70 high and a late 2024 peak near $14.93.
If OMNI falls below $4.03, it may retest support near $3.30, with deeper levels at $2.18, $2.00, and $1.21 on the radar for bears.
OMNI/USD: Four-Hour chart portrays start of Bull-Run

Unlike the daily chart, OMNI/USD’s four-hour chart signals a potential bull run, confirming a seven-month “Falling Wedge” pattern with fewer near-term resistance levels. In doing so, the bulls appear undeterred by the overbought RSI conditions.
That said, the key resistance levels are the recent high of $5.56 and the late February peak at $6.75. Breaking these could open the way toward the “Falling Wedge” target near $16.50, though daily chart barriers may slow progress.
Alternatively, a pullback seems unlikely unless prices fall below the wedge’s top line around $2.85. Further support lies near the 200-bar SMA at $1.74 and the wedge’s bottom at $1.33, alongside daily chart supports.
In summary, OMNI prices look poised to hold gains and potentially close above the 200-day SMA, but fully recovering the 47% yearly loss remains challenging.


