- Polkadot sellers take a breather after hitting the lowest level in over a week.
- Multi-month resistance-turned-support challenge DOT bears as RSI returns from overbought territory.
- Key SMAs add to downside filters, DOT/USD buyers are likely to remain worried below 200-day SMA.
Polkadot (DOT/USD) price hesitates declining past the nine-day low flashed early Thursday, hovering around the intraday bottom near $4.00 during the U.S. session. In doing so, the DOT/USD sellers jostle with a previous resistance line from early January, now immediate support, to extend a two-day losing streak.
DOT/USD: Daily Chart Challenges Bears
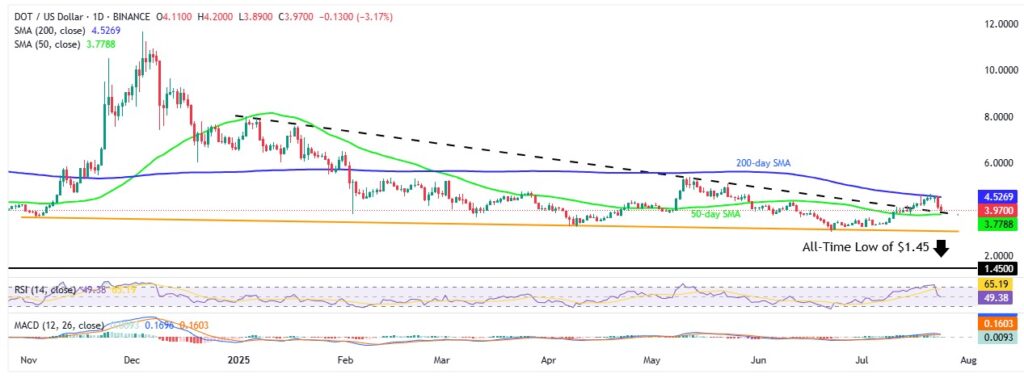
Apart from the key resistance-turned-support, a return of the 14-day Relative Strength Index (RSI) from overbought territory and sluggish signals from the Moving Average Convergence Divergence (MACD) indicator also challenge the DOT sellers. However, the quote’s failure to cross the 200-day Simple Moving Average (SMA) during July’s rally seem to challenge buyers from expecting a reversal of 40% yearly loss.

Polkadot’s early-week reversal from the 200-day SMA coincides a pullback in the RSI Iine from the overbought territory, currently around the 50.0 neutral level. The same joins a downward-sloping resistance-turned-support line from early January, close to $3.90 by the press time, to challenge further declines of the DOT/USD pair. Apart from that, recently sluggish signals from the MACD also test the DOT bears.
Even if the DOT price breaks the $3.90 key support, the 50-day SMA support of $3.77 and early July swing high of $3.67 will test the sellers before directing them to a long support line stretched from November 2024, close to $3.10.
It’s worth noting that the DOT/USD pair’s sustained weakness past $3.10, as well as a downside break of the $3.00 threshold, will make it vulnerable to slump toward the all-time low of $1.45.
Alternatively, Polkadot’s recovery remains elusive unless it offers a daily closing beyond the 200-day resistance of $4.53. Even so, the monthly high and May’s peak, respectively near $4.68 and $5.39, could threaten the recovery momentum before highlighting a run-up toward $6.00 comprising multiple levels marked during late 2024 and early 2025.
DOT/USD: Four-Hour Chart Portrays Bearish Exhaustion

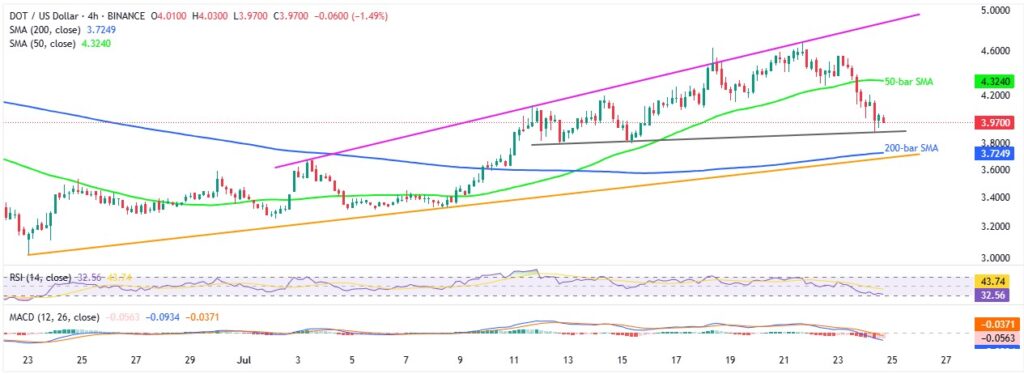
Unlike the daily chart, the four-hour DOT chart shows nearly oversold RSI as sellers poke a week-long support near $3.90, suggesting a tough nut to crack. Even if the prices drop below $3.90, the 200-bar SMA and an upward-sloping support line from late June, close to $3.72 and $3.68, will challenge the bears ahead of directing them toward the deeper levels discussed on the daily chart.
On the contrary, DOT/USD recovery could aim for the 50-bar SMA of $4.32 before targeting the latest peak of $4.68. However, a three-week-old rising trend line near $4.88 will act as the final defense of the Polkadot sellers, at least for the short-term, before suggesting notable rally toward the daily chart levels.
To sum up, Polkadot’s longer-term bearish trend can prevail but the prices may witness a corrective bounce in the short-term.


