- Polkadot hits two-week high after clearing key multi-month resistance.
- Bullish RSI and MACD back DOT breakout toward key simple moving averages.
- DOT/USD buyers stay cautious below $5.40; eight-month downtrend line remains key for bears.
Polkadot (DOT/USD) is up over 1.0% to $3.60 ahead of Thursday’s U.S. session, as buyers react to a breakout above a seven-month-old descending trend line resistance. Supporting the bullish bias are multiple rebounds from a downward-sloping support line drawn from November 2024, along with positive signals from the 14-day Relative Strength Index (RSI) and a bullish Moving Average Convergence Divergence (MACD) crossover. Even so, DOT/USD still shows a nearly 45% loss for 2025 and remains below key Simple Moving Averages (SMAs), suggesting the recovery is still facing strong headwinds.
DOT/USD: Daily chart points to long road for bulls

Source: TradingView
Polkadot’s (DOT/USD) breakout above a seven-month descending resistance line is gaining momentum, backed by bullish signals from the 14-day RSI and the MACD indicator. This setup opens the door for a further move toward the 100-day SMA, currently near $4.05.
However, bulls still face strong resistance. The 200-day SMA around $4.90, the $5.00 psychological level, and June’s high near $5.40 stand as key barriers. A clear break above these could hand full control to buyers, with potential targets at the mid-January swing high of $7.60, the 2025 peak of $8.02, and eventually the $10.00 psychological mark.
On the downside, immediate support lies at the former resistance near $3.40. Below that, a descending trendline support from November 2024 near $3.05 and the $3.00 level could slow any pullback. If DOT/USD drops below $3.00, a deeper decline toward the record low near $1.45 becomes a real risk.
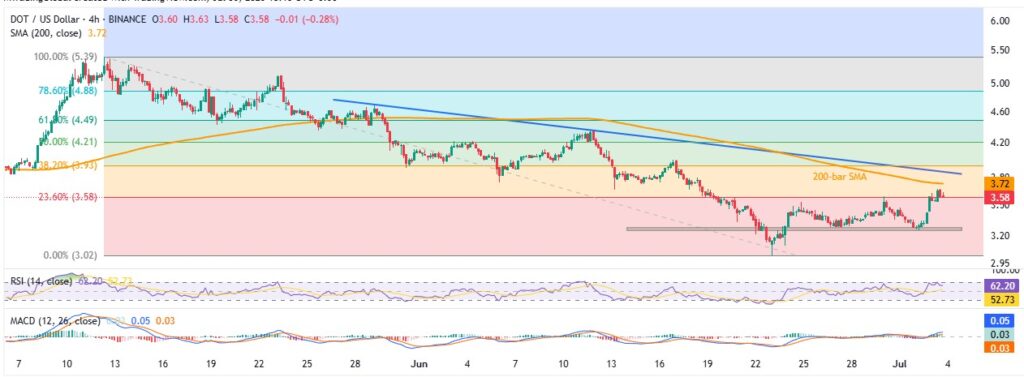
DOT/USD: Four-Hour chart portrays buyer’s struggle

Source: TradingView
On the four-hour chart, Polkadot bounces off a two-week-old horizontal support, with bullish signals from the MACD providing further backing. However, the 14-bar RSI is hovering near overbought territory, highlighting short-term resistance levels at the 200-bar SMA near $3.72 and a five-week-old descending trendline around $3.85. These levels, along with the daily chart, will be key to watch for potential breakout or reversal.
On the downside, the $3.28 horizontal support and the yearly low around $3.00 from June will be crucial for Polkadot bears to defend before attention shifts to deeper levels on the daily chart.
Overall, while Polkadot is poised for a bullish move, reversing its yearly loss remains a challenging task.


