- Polkadot price faces its biggest daily loss in two weeks, falling for a second straight day within a multi-month triangle pattern.
- Neutral RSI and weak MACD signal more DOT downside, but an ascending trendline from June may offer strong support.
- Nearly oversold RSI on the four-hour chart highlights $3.70 support; 200-day EMA, three-month resistance line act as additional upside filters.
- Short-term downside pressure prevails, but the triangle formation is likely to hold.
Polkadot (DOT) price dips over 5% to $3.89 heading into Monday’s U.S. trading session, echoing broad altcoin weakness and retreating from a multi-month resistance. With this, traders brace for key U.S. data after Fed Chair Jerome Powell emphasized data-driven rate cuts, after almost confirming a September rate reduction.
Also read: Powell’s Rate Cut Hint Ignites Markets: Crypto Volatility as Dovish Shift Begins
Adding strength to Polkadot’s latest fall are steady conditions in the 14-day Relative Strength Index (RSI) and sluggish signals from the Moving Average Convergence Divergence (MACD), indicating continued bearish momentum.
Furthermore, a two-week high trading volume also suggests trader’s participation in the latest Polkadot fall and keeping them onboard. According to Santiment, the DOT’s daily trading volume jumps to $522.11 million, the highest since August 14, whereas the market cap drops for the second consecutive day to $6.23 billion.
Despite the DOT’s fall, an upward-sloping trend line from June could challenge the bears, keeping the multi-month triangle formation intact, especially when the RSI is nearly oversold on the shorter timeframe.
Polkadot Price: Daily Chart Favors Sellers

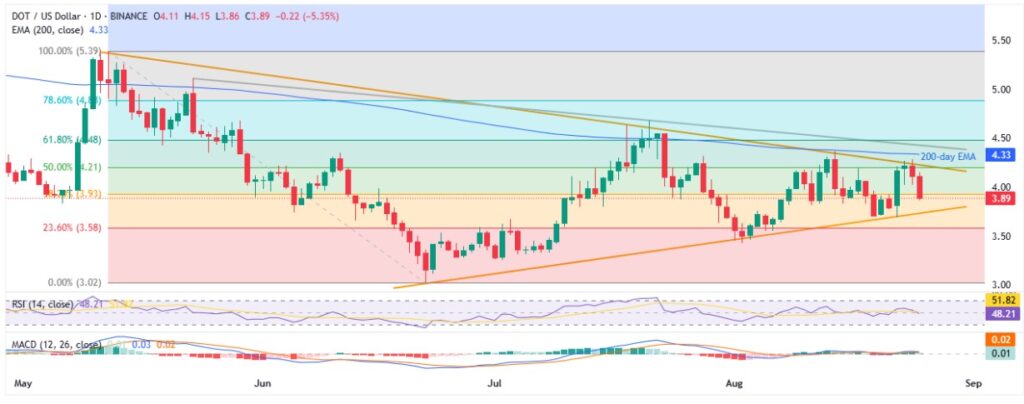
A clear U-turn from the descending resistance since May, steady RSI, and sluggish MACD signal together suggest Polkadot’s further weakness toward a two-month rising support trend line, close to $3.70.
If the DOT drops beneath the key $3.70 support, the monthly low of $3.43 and the yearly bottom surrounding $3.15 could test the bears before directing them to the $3.00 psychological magnet.
Notably, Polkadot’s weakness past $3.00 makes it vulnerable to approach the all-time low marked in August 2020, around $1.42. That said, the $2.00 round figure might act as an intermediate halt during the anticipated fall past $3.00.
Meanwhile, DOT’s recovery remains elusive beneath the aforementioned resistance line from May, close to $4.25. Also acting as the key upside hurdle is the 200-day Exponential Moving Average (EMA) and a three-month trend line resistance, close to $4.33 and $4.45 in that order.
Moving on, the quote’s upside past $4.45 could aim for the 61.8% and 78.6% Fibonacci retracement of the DOT’s May-June downside, respectively near $4.48 and $4.88, closely followed by the $5.00 psychological magnet and May’s peak of $5.40.
Polkadot Price: Four-Hour Chart Suggests Limited Downside Room

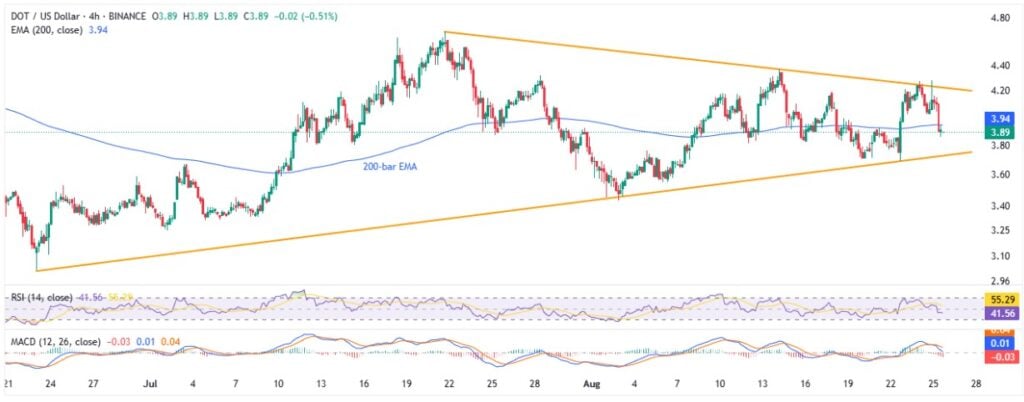
Unlike the daily chart, the DOT’s four-hour projection highlights limited downside room as the RSI drops beneath the 50.00 neutral level, suggesting overheated selling.
However, the DOT’s break below the 200-bar EMA and bearish MACD signals point to further downside toward the ascending support line from June, near $3.70.
If the RSI hits the oversold level of 30.00 around the $3.70 support, a rebound is possible; Otherwise, a quick drop to the monthly low of $3.43 may follow, exposing deeper support levels on the daily chart.
On the contrary, Polkadot’s recovery should initially cross the 200-bar EMA hurdle of $3.94 ahead of a five-week resistance line surrounding $4.22. If the DOT buyers remain dominant past $4.22, the higher levels discussed on the daily chart will be on their radar.
Conclusion
Polkadot stays pressured toward the $3.70 key support, with further downside possible if bears break below. However, strong trendline support and oversold RSI signals on the four-hour chart may trigger the DOT’s bounce. Hence, watch for a reaction at $3.70 to decide the next move while keeping in mind the triangle formation.
Also read: A Top Trader Just Leaked the Blueprint for the ‘Greatest Altcoin Season’ with $4T Market Cap


