- Polkadot buyers again battle 21-day SMA hurdle, reigniting momentum after June–July fakeouts.
- Higher DOT price lows align with rising RSI bottoms and a key resistance line breakout to fuel buyer optimism.
- Six-month trendline resistance and 200-day SMA pose key hurdles as DOT/USD aims to reverse its yearly losses.
- A break below $3.00 could embolden DOT/USD bears to target the record low.
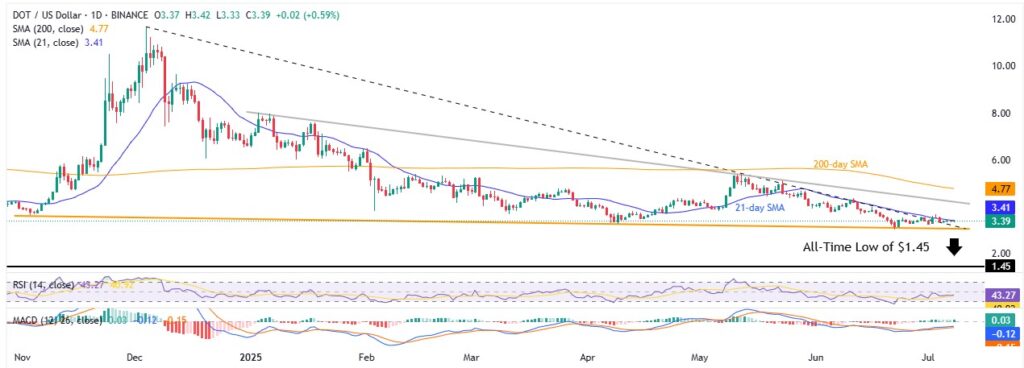
Polkadot (DOT/USD) gains 0.80% intraday to reach $3.40 during Tuesday’s U.S. trading session, marking its third attempt to break above the 21-day Simple Moving Average (SMA) resistance after two failed tries in June and early July. Notably, the price successfully broke a seven-month resistance line, supported by an upbeat pattern in the 14-day Relative Strength Index (RSI) and bullish signals from the Moving Average Convergence Divergence (MACD). These factors strengthen hopes for a sustained breakout above the immediate upside hurdle.
DOT/USD: Daily chart signals optimism for bulls

Source: TradingView
Polkadot has successfully broken out of a descending trend line that started in early December 2024, forming a bullish pattern where higher lows in price match higher lows in the Relative Strength Index (RSI). This strengthens the bullish outlook and suggests a likely breakout above the 21-day SMA resistance at $3.41.
Beyond this, a six-month resistance near $4.23 and the 200-day SMA around $4.77 will challenge the bulls as they attempt to recover from a nearly 45% yearly loss.
On the downside, a pullback remains unlikely as long as the price holds above the December 2024 resistance-turned-support line near $3.20. If bears break below $3.20, the descending trend line support from November 2024, close to $3.00, will serve as the bulls’ last defense. A break below this level could trigger a drop toward the all-time low near $1.45, with $2.00 likely acting as an intermediate support along the way.
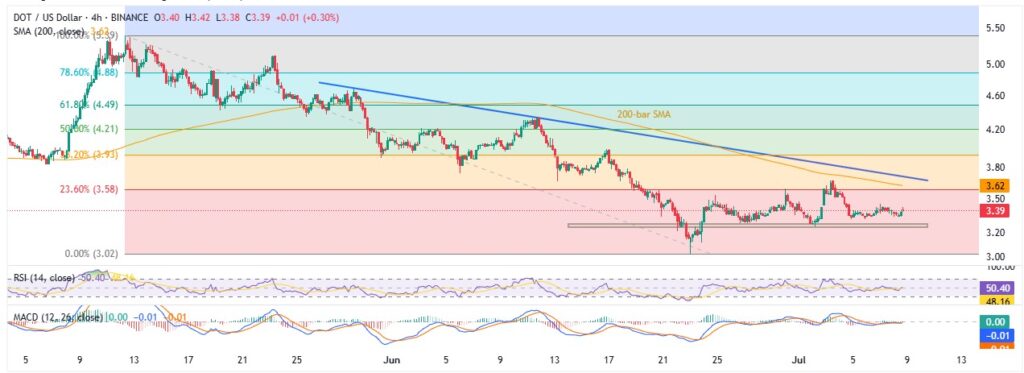
DOT/USD: Four-Hour chart portrays buyer’s struggle

Source: TradingView
On the four-hour chart, Polkadot continues to bounce off a two-week-old horizontal support zone between $3.27 and $3.24. This support, combined with an upbeat Relative Strength Index (RSI) above 50, points the DOT/USD pair toward the 200-bar Simple Moving Average (SMA) resistance at $3.62, followed by a descending resistance line from late May near $3.72. If buyers hold control above $3.72, they are likely to target the higher resistance levels seen on the daily chart.
Alternatively, a break below the $3.27–$3.24 support zone could push prices down quickly to the previous monthly low of $3.02, before testing the key $3.00 support noted in the daily analysis, which is critical for determining the pair’s next bearish move.
Overall, Polkadot looks set to break above the immediate 21-day SMA and reduce its significant yearly losses, but a full reversal will require a strong fundamental catalyst.


