- Polkadot price seesaws at 10-week low, pauses four-day downtrend as bears stall within multi-month triangle pattern.
- DOT remains under pressure as bearish MACD and sustained weakness below key SMAs outweigh any short-term bounce risk from oversold RSI.
- DOT/USD risks a drop to its all-time low if $3.10 support breaks, with the recovery outlook dim under the 200-day SMA.
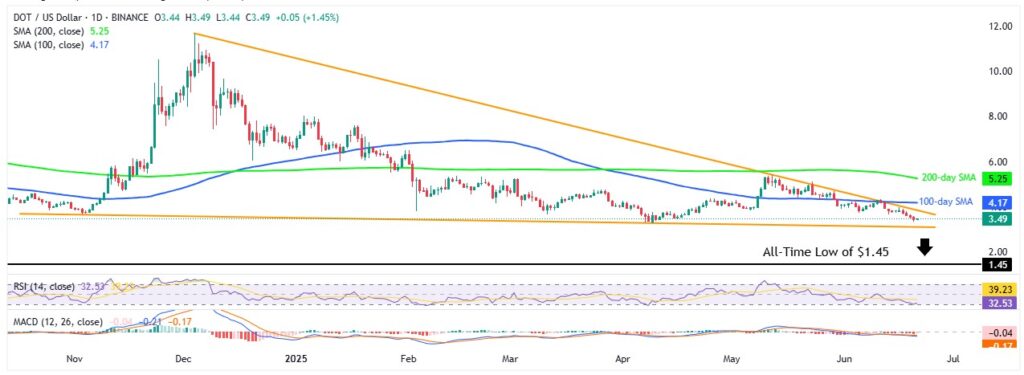
Polkadot (DOT/USD) price bounces off a 10-week low while pausing a four-day losing streak with mild gains around $3.48 early Saturday. Even so, DOT is still defending last week’s pullback from the 100-day Simple Moving Average (SMA) and the top of a seven-month triangle pattern. This joins with the bearish signals from the Moving Average Convergence Divergence (MACD) indicator to suggest a possible drop toward the triangle’s lower boundary. However, the 14-day Relative Strength Index (RSI) is nearing oversold levels, which could limit further downside and lower the risk of hitting a new all-time low (ATL).
DOT/USD: Daily chart keeps bears hopeful

Source: Tradingview
Despite the latest corrective bounce, bearish MACD signals and DOT/USD’s continued trading below key Simple Moving Averages (SMAs) suggest sellers are positioned to retest the yearly low near $3.25. However, the nearly oversold 14-day Relative Strength Index (RSI) may limit further downside around the triangle’s bottom at $3.10.
If sellers break below $3.10, the next supports lie at $3.00 and $2.00, before the record low of $1.45 comes into play. A drop below that could open the door to a fresh all-time low near $1.00.
On the flip side, recovery faces immediate resistance at the triangle’s upper boundary of $3.90, followed by the 100-day SMA at $4.17. A clear break above these could lead Polkadot prices to the $5.00 level and the 200-day SMA of $5.25, which marks the final barrier before bulls regain control.
DOT/USD: Four-Hour chart signals sluggish South-Run

Source: Tradingview
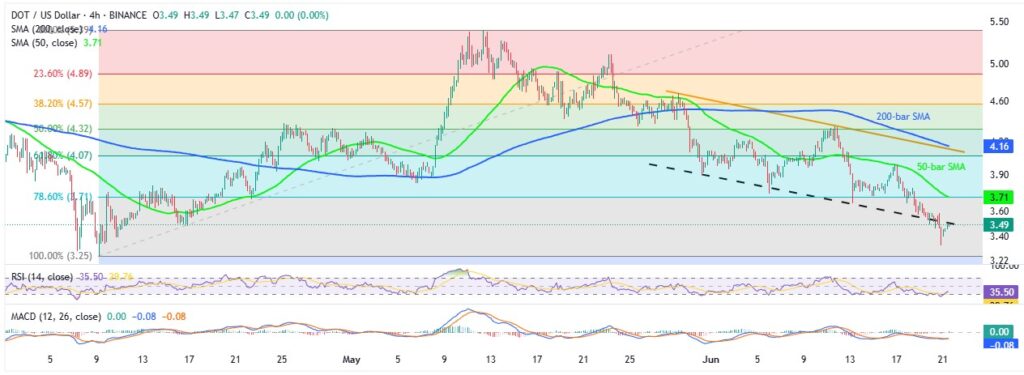
Unlike the daily chart, Polkadot’s (DOT/USD) four-hour chart shows buyer exhaustion, with the Relative Strength Index (RSI) near oversold and price testing the lower edge of a monthly bearish channel, a key former support. While a sluggish Moving Average Convergence Divergence (MACD) hints at a possible short-term bounce, the 50-bar Simple Moving Average (SMA) near $3.71 is likely to cap gains.
If DOT holds above $3.71, resistance lies at the channel’s upper boundary near $4.14 and the 200-bar SMA at $4.16, before facing daily chart hurdles.
Alternatively, immediate support is seen at the recent low of $3.33 and April’s bottom at $3.25. A deeper fall could expose lower support zones from the daily chart.
In summary, DOT/USD remains at risk of further losses and a possible retest of the yearly low. However, oversold RSI and support from the broader triangle pattern may limit the chance of a new all-time low.


