- Polkadot price drops 4.0%, hitting a fresh weekly low, amid broad crypto market consolidation.
- Break below key EMAs and bearish momentum signals keep DOT sellers optimistic.
- Polkadot’s defense of its four-month uptrend depends on the nine-week ascending trendline.
- DOT recovery remains elusive below $4.68; several support levels can offer a bumpy road to bears past $3.87.
- Polkadot’s short-term downside appears promising, but the multi-month bullish trend is likely to hold.
Polkadot (DOT) plummets 4.0% to $4.10, hitting a weekly low, as crypto traders face consolidation early Thursday.
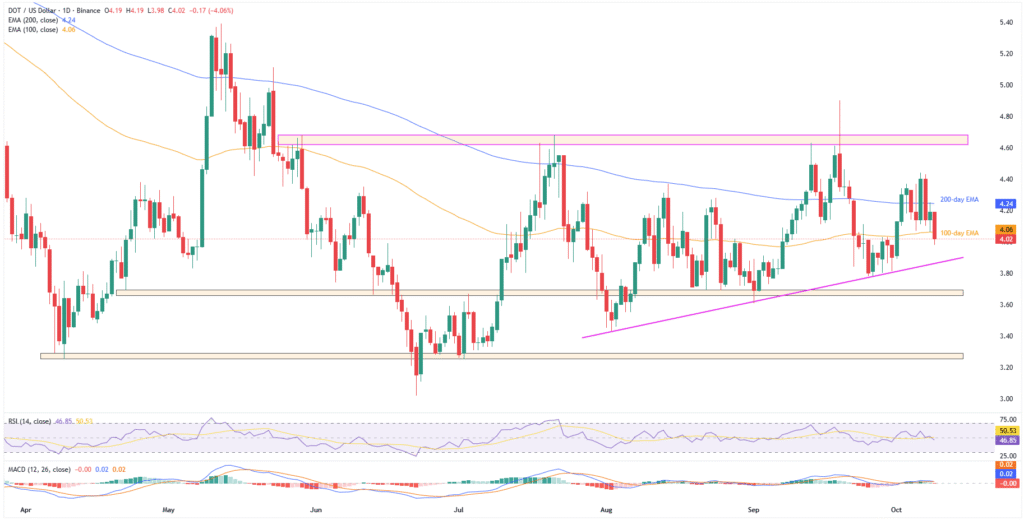
The DOT’s latest slump follows a downside break of the 100-day Exponential Moving Average (EMA), reversing the previous day’s bounce while extending the pullback from the 200-day EMA.
Alongside the 100-day EMA breakdown, an impending bearish crossover on the Moving Average Convergence Divergence (MACD) momentum indicator, as well as downbeat conditions of the 14-day Relative Strength Index (RSI), also reinforce Polkadot’s short-term downside bias.
Still, weak trader participation and an ascending trendline from early August challenge the DOT bears from taking control, as the quote defends its four-month uptrend. That said, Polkadot’s daily trading volume hits a five-day low of $286.93 million, whereas the market capitalization (market cap) drops to the lowest level in a week, around $6.53 billion by press time, according to Santiment.
Also read: Crypto Morning News: Bitcoin Holds at 123K as Gold Tops $4,000, Gaza Truce Lifts Global Mood
Polkadot Price: Daily Chart Suggests Limited Downside

Polkadot’s clear reversal from the 200-day EMA, as well as a downside break of the 100-day EMA, bolsters a short-term bearish outlook about the altcoin. Adding strength to the downside bias is the looming bearish crossover on the MACD (a slightly red histogram) and a below-50.00 RSI line.
With this, the DOT looks poised to extend the latest fall toward an ascending trendline support from early August, close to $3.87 by press time.
However, weaker participation from traders may defend the quote’s four-month uptrend near the said support line; if not, then multiple lows marked since late April between $3.69 and $3.66 will lure the Polkadot bears.
Below that, a six-month horizontal support zone near $3.25-$3.29 will be the last defense of buyers before eyeing the fresh yearly low, currently near $3.02.
Alternatively, the 100-day and 200-day EMAs, respectively near $4.06 and $4.24, restrict short-term DOT recovery before the monthly high of $4.44.
Notably, a broad resistance zone from late May, between $4.62 and $4.68, will be the last defense of bears before handing control to the buyers.
In that case, the $5.00 threshold and May’s peak of $5.39 could test the bulls before directing them to the early 2025 highs surrounding $6.50, $7.60, and the yearly high of $8.02.
Polkadot Price: Four-Hour Chart Tests Buyers

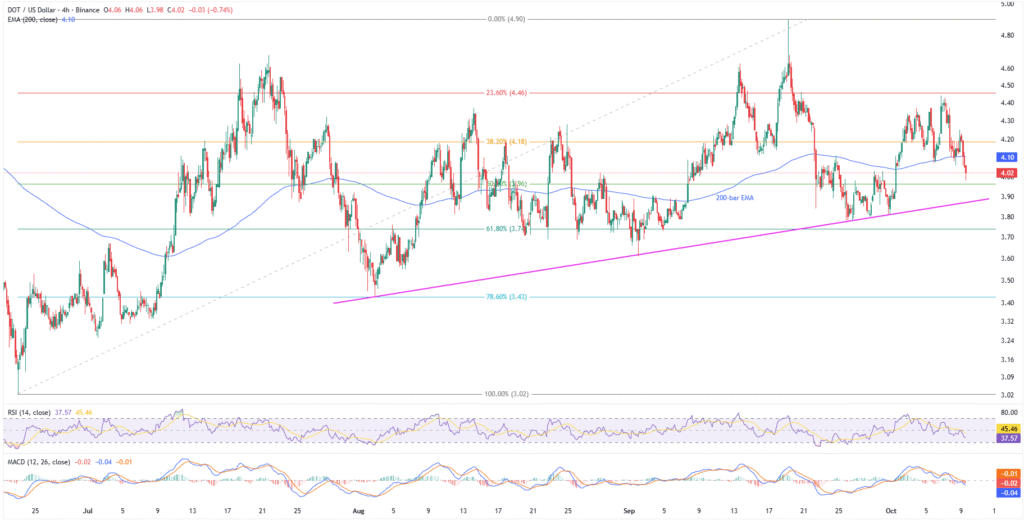
On the four-hour chart, Polkadot’s downside break of the 200-bar EMA joins comparatively stronger bearish MACD signals and weaker RSI than the daily chart, to underpin bearish bias.
However, the RSI line is closer to the oversold limit of 30.00, highlighting the importance of the two-month support surrounding $3.87.
Following that, the 61.8% and 78.6% Fibonacci retracements of its June-September upside, respectively near $3.74 and $3.43, might encourage sellers ahead of the daily chart’s deeper support levels.
On the contrary, the 200-bar EMA 23.6% Fibonacci ratio, close to $4.10 and $4.46 in that order, restricts short-term DOT recovery ahead of the higher levels discussed on the daily chart.
Conclusion
Polkadot’s recent decline follows the EMA breakdown and bearish momentum signals. However, the downside seems limited as long as prices stay above $3.87, with a break below that level potentially threatening its four-month uptrend.
Also read: Top 5 Altcoins to Watch in October 2025


