- Polkadot price snaps three-day losing streak, bouncing off short-term key support confluence.
- Momentum indicators support DOT’s rebound, but key SMA convergence guards immediate upside.
- A clear break of $4.05 allows Polkadot to challenge the four-month resistance area.
- DOT’s sustained trading below $3.88 could pause the three-month uptrend, adding to the yearly loss.
- Short-term recovery is likely to prevail, but reversal of yearly loss needs a strong catalyst.
Polkadot (DOT) breaks a three-day losing streak with a fresh daily gain near $4.05, bouncing off key short-term support and testing crucial moving averages early Wednesday.
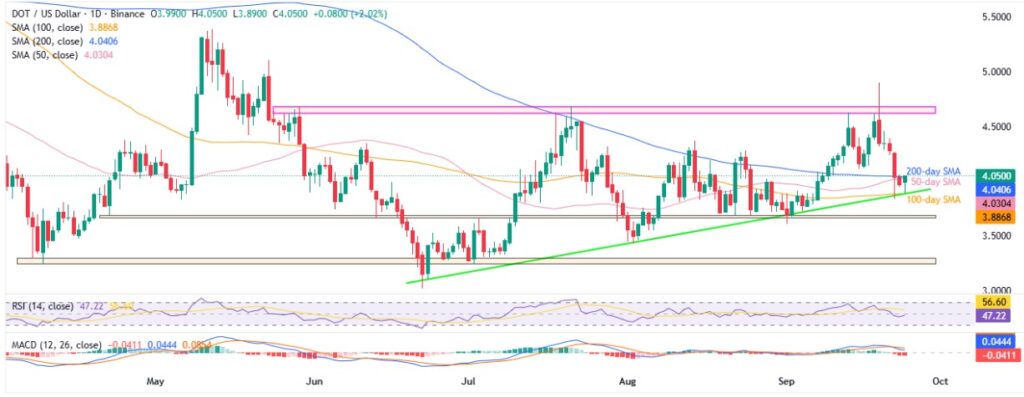
That said, the DOT rebounds from a joint of the 100-day Simple Moving Average (SMA) and a three-month rising support line, close to $3.88 at the latest. However, the 50-day and 200-day SMA confluence challenge the quote’s immediate upside around $3.04-05.
Adding to the trader’s indecision is the steady conditions of the 14-day Relative Strength Index (RSI) and bearish signals from the Moving Average Convergence Divergence (MACD).
Still, an improvement in the trading volume and market capitalization (market cap) backs the DOT’s latest rebound, suggesting further upside. According to Santiment, Polkadot’s daily trading volume rises to $278.94 million, while the market cap recovers from a fortnight’s low of $6.53 billion.
Hence, the altcoin’s latest recovery becomes interesting and can even challenge the yearly loss, if it gains momentum support.
Polkadot Price: Daily Chart Lures Buyers

Polkadot’s recovery from the 100-day SMA and a three-month ascending trendline gains support from a steady 14-day RSI, but the bearish MACD signals and a convergence of the 200-day and 50-day SMA challenge the bulls below $4.05.
Hence, a clear break of $4.05 becomes necessary for the DOT bulls to tighten control, as it will not only cross the immediate SMA confluence but also portray a “Golden Cross” bullish moving average crossover, with the 50-day SMA piercing the 200-day SMA from below.
This could allow the Polkadot buyers to quickly challenge the mid-month bottom surrounding $4.11 ahead of confronting a broad resistance zone since late May, close to $4.61-$4.68.
Beyond that, the monthly high of $4.90, the $5.00 threshold, and May’s peak of $5.39 could lure the buyers while aiming to reverse the yearly loss, currently around 38.0%.
Meanwhile, a downside break of $3.88 support confluence, including the 100-day SMA and multi-month trendline, could expose prices to a five-month horizontal support near $3.66 and the monthly low of $3.61.
Should the DOT bears keep reins past $3.61, multiple levels since early April, near $3.29-$3.25, followed by the yearly low marked in June around $3.02, might gain the market’s attention.
Polkadot Price: Four-Hour Chart Appears More Bullish

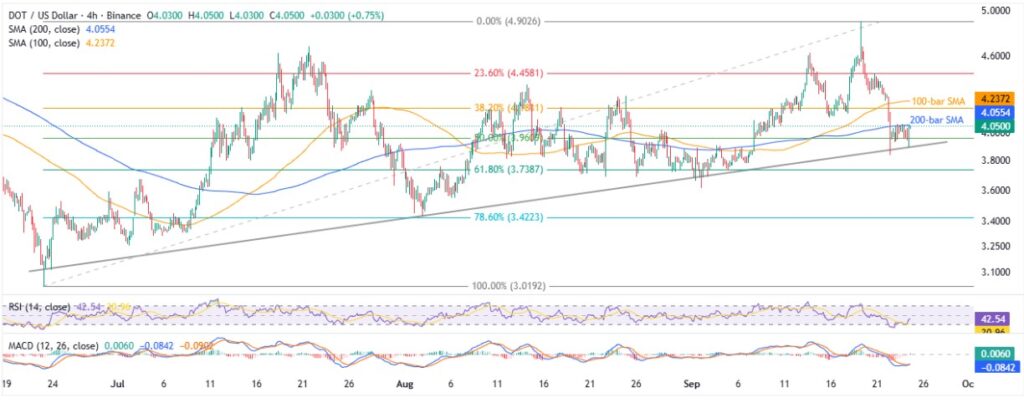
Polkadot’s four-hour chart appears to be more bullish than the daily formation as the RSI line rebounds from the oversold territory and the MACD is about to post a bullish signal after almost a week.
This could allow the DOT buyers to cross the 200-bar and 100-bar immediate hurdles, respectively near $4.05 and $4.24.
After that, July’s high near $4.68 and the levels mentioned on the daily chart will be in the spotlight.
Conversely, 61.8% and 78.6% Fibonacci retracement levels of the DOT’s June-September upside, respectively near $3.73 and $3.42, could act as additional downside filter during the quote’s fall beneath the immediate $3.88 support confluence, discussed on the daily chart.
Conclusion
Polkadot’s (DOT) bounce off the 100-day SMA and multi-month trendline is backed by strong RSI and MACD signals, boosting chances of further gains. But a daily close above $4.05 is crucial to unlock more upside and challenge the yearly loss.
Also read: Crypto Roundup: BTC Reclaims $113K, Gold Eyes $3,800 amid Trump, Powell Buzz


