- Polkadot price gains over 1.0%, ending a two-day slide to put the spotlight back on the multi-month resistance zone.
- DOT’s steady hold above key SMAs and early September breakout levels defends buyers.
- Upbeat RSI and MACD momentum indicators also reinforce Polkadot’s upside bias.
- Sellers remain off the table beyond $3.87, while an upside break of $4.70 can challenge the multi-month trading range.
Polkadot (DOT) price climbs over 1.0% intraday to $4.21 early Tuesday in New York, posting the first daily gains in three, so far, while defending prior bullish breakouts.
The altcoin’s latest gains take clues from the broad U.S. Dollar weakness ahead of Wednesday’s Federal Reserve (Fed) Interest Rate Decision.
Adding strength to the latest rebound are upbeat conditions of the 14-day Relative Strength Index (RSI) and the Moving Average Convergence Divergence (MACD) momentum indicators.
However, a 16-week-old horizontal resistance area appears to be a tough nut to crack for the DOT bulls to defy the multi-month trading range and aim to reverse the yearly loss.
Polkadot’s recovery also benefits from upbeat trading volume and a rebound in the market capitalization (market cap) to keep buyers hopeful. That said, the DOT’s daily trading volume stays firmer around $317.27 million, whereas the market cap rebounds to $6.85 billion by press time, according to Santiment.
With this, DOT looks poised to challenge multi-week resistance, while also eyeing a bullish breakout of its seven-month trading range, though gains may unfold more gradually than a sharp rally.
Polkadot Price: Daily Chart Favors Buyers

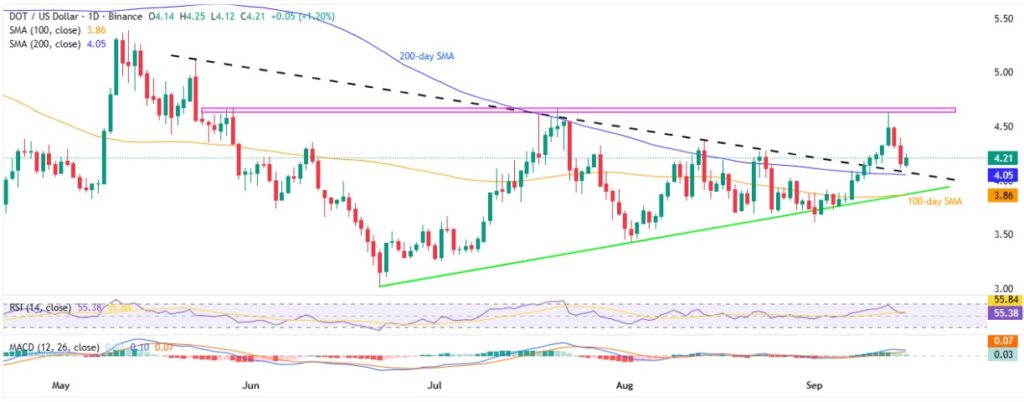
A clear rebound from the descending trendline (now support) since May and the 200-day SMA, backed by steady bullish RSI and MACD signals, suggests Polkadot (DOT) may extend its recovery toward the $4.63–$4.68 resistance zone, marked by multiple tops since late May.
The quote’s further upside, however, needs a strong fundamental catalyst as multiple hurdles restrict the DOT moves since February below $5.40, with the $5.00 acting as an intermediate halt.
Beyond that, Polkadot buyers become capable of targeting the yearly high of $8.50, with interim resistances around $6.50 and $7.58 offering potential pause points along the way.
On the flip side, the resistance-turned-support line from May, close to $4.10, joins the 200-day SMA support near the $4.00 threshold to restrict short-term DOT downside.
Should Polkadot sellers remain dominant past $4.00, a convergence of the 100-day SMA and an ascending trendline from late June, close to $3.86, will be the last line of battle for them before taking over control.
Polkadot Price: Four-Hour Chart Points To Multiple Resistances

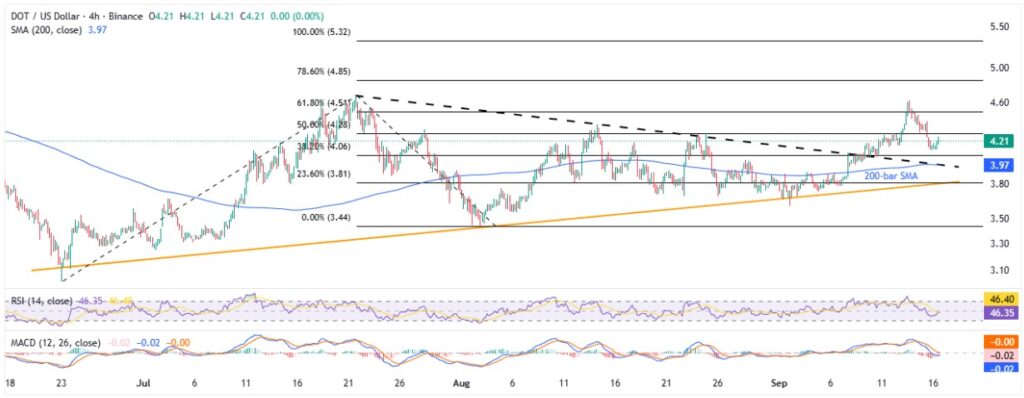
Unlike the daily chart, the DOT’s four-hour projection appears to be more bullish as the RSI recovers toward the 50.00 neutral level from the oversold territory near 30.00.
Adding strength to the upside bias is the quote’s sustained trading beyond the $3.97 support confluence, comprising the 200-bar SMA and a descending resistance line from late July, now support.
With this, the altcoin looks poised to approach the 50% and 61.8% Fibonacci Extension (FE) of its June-August moves, respectively near $4.30 and $4.50, before heading toward the $4.70 key resistance and the daily chart’s higher levels.
Alternatively, a clear downside break of $3.97 will need validation from the $3.86 support confluence comprising an ascending trendline from late June and the 100-day SMA, mentioned on the daily chart.
Below that, the previous monthly low near $3.50 and deeper levels discussed on the daily chart will be in the spotlight.
Conclusion
Polkadot (DOT) buyers may eye a move back to the $4.70 resistance—and possibly beyond—if supported by a dovish Federal Reserve, weaker U.S. Dollar, and positive crypto news. However, breaking past the 7.5-month trading range and reversing the 36% yearly loss will require a strong catalyst and a clear push above the $5.40 resistance.Bottom of Form
Also read: Cryptocurrency Weekly Price Prediction: BTC, ETH, XRP Rally as Markets Bet Big on FOMC Rate Cuts


