- Ripple price slides over 2.0% to hit a weekly low while fading bounce off multi-month support.
- Bearish MACD signals, RSI’s retreat from the overbought zone reinforce XRP’s downside bias.
- Key SMA convergence and eight-month support line can challenge XRP/USD bears past $2.80.
- XRP recovery may aim for $3.33 before facing the key resistance line from April 2021.
Ripple (XRP/USD) price refreshes weekly low around $3.05, down 2.4% intraday, as the New York trading bell rings for Wednesday.
The XRP/USD pair’s latest weakness could be linked to its inability to defend the previous week’s corrective bounce from a nearly eight-month-old broad support region. Adding strength to the downside could be the bearish signals from the Moving Average Convergence Divergence (MACD) indicator and a pullback in the 14-day Relative Strength Index (RSI) from the overbought territory.
Even if the XRP’s revisit to a multi-month support appears imminent, its further downside could be difficult as the key Simple Moving Averages (SMA) and a support line will challenge the bears.
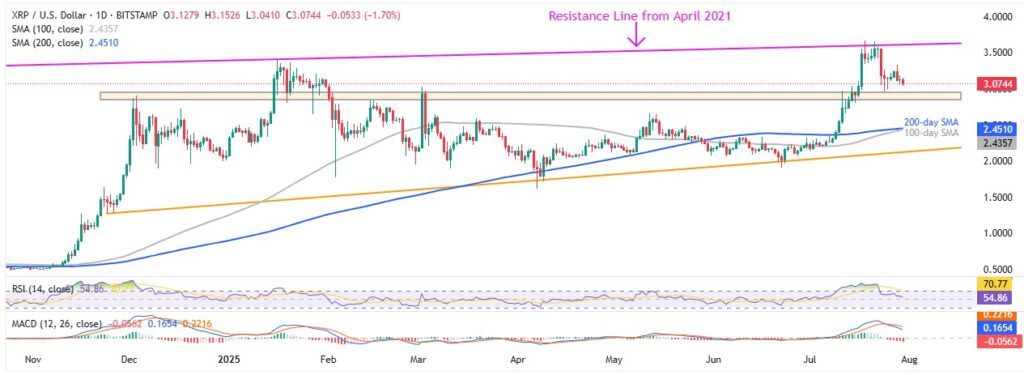
Ripple: Daily Chart Signals Limited Downside Room

Although failure to defend the recovery from a horizontal support zone established since December 2024 joins bearish MACD signals and a pullback in the RSI, not oversold, to keep the Ripple sellers hopeful, the return of the bearish trend is arguable.
That said, the broad support area surrounding $2.80-$2.95 will be a tough nut to crack for the XRP/USD bears before approaching a convergence of the 100-day and 200-day SMA, around $2.45-$2.43.
Even if the prices fail to rebound from the said SMA confluence, an eight-month-old rising trend line support, close to $2.10 at the latest, will act as the final defense of the buyers.
In a case where the XRP/USD remains weak past $2.10, the odds of witnessing the quote’s gradual south-run towards the yearly low of $1.61 marked in April, with the $2.00 threshold acting as an intermediate halt, can’t be ruled out.
Alternatively, Ripple’s recovery could initially aim for Monday’s peak, surrounding $3.33, before approaching an ascending resistance line from April 2021, near $3.62 by the press time, closely followed by the all-time high marked earlier in the month around $3.66.
It’s worth noting, however, that the XRP’s successful breakout of $3.66 won’t hesitate to target the $4.00 psychological magnet.
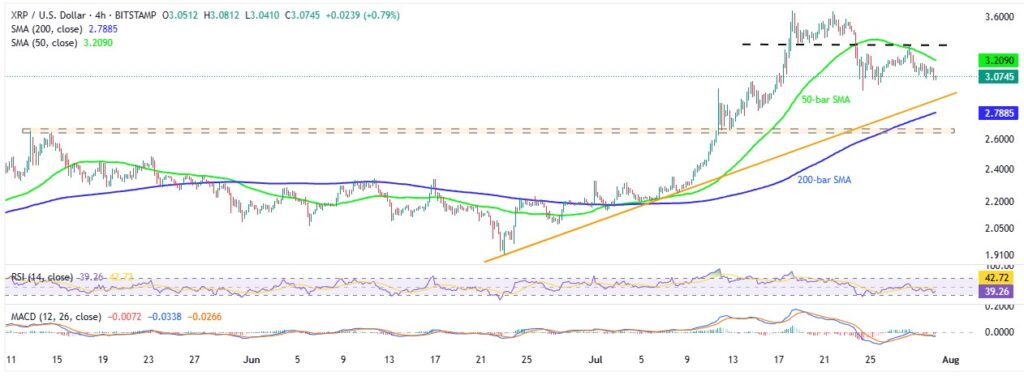
Ripple: Four-Hour Chart Shows Bearish Exhaustion

While the XRP/USD pair remains under pressure, the four-hour chart shows bears losing steam as the RSI approaches the oversold territory and the MACD signals fade the red shine.
Still, a rejection from the 50-bar SMA and a two-week resistance line directs XRP bears toward the $3.00 round figure.
Following that, a five-week-old ascending support line around $2.88 and the 200-bar SMA of $2.78 can test sellers before highlighting an 11-week support region surrounding $2.68-$2.65.
On the contrary, Ripple’s recovery needs validation from the 50-bar SMA of $3.20 and a two-week-long horizontal resistance area of around $3.33 to convince buyers to aim for the higher resistance levels discussed on the daily chart.
Overall, XRP/USD remains on the back foot and is likely to refresh its weekly low even as the room towards the south appears limited.
Also read: Media Personality Fuels XRP Frenzy With U.S. Acquisition Rumors!


